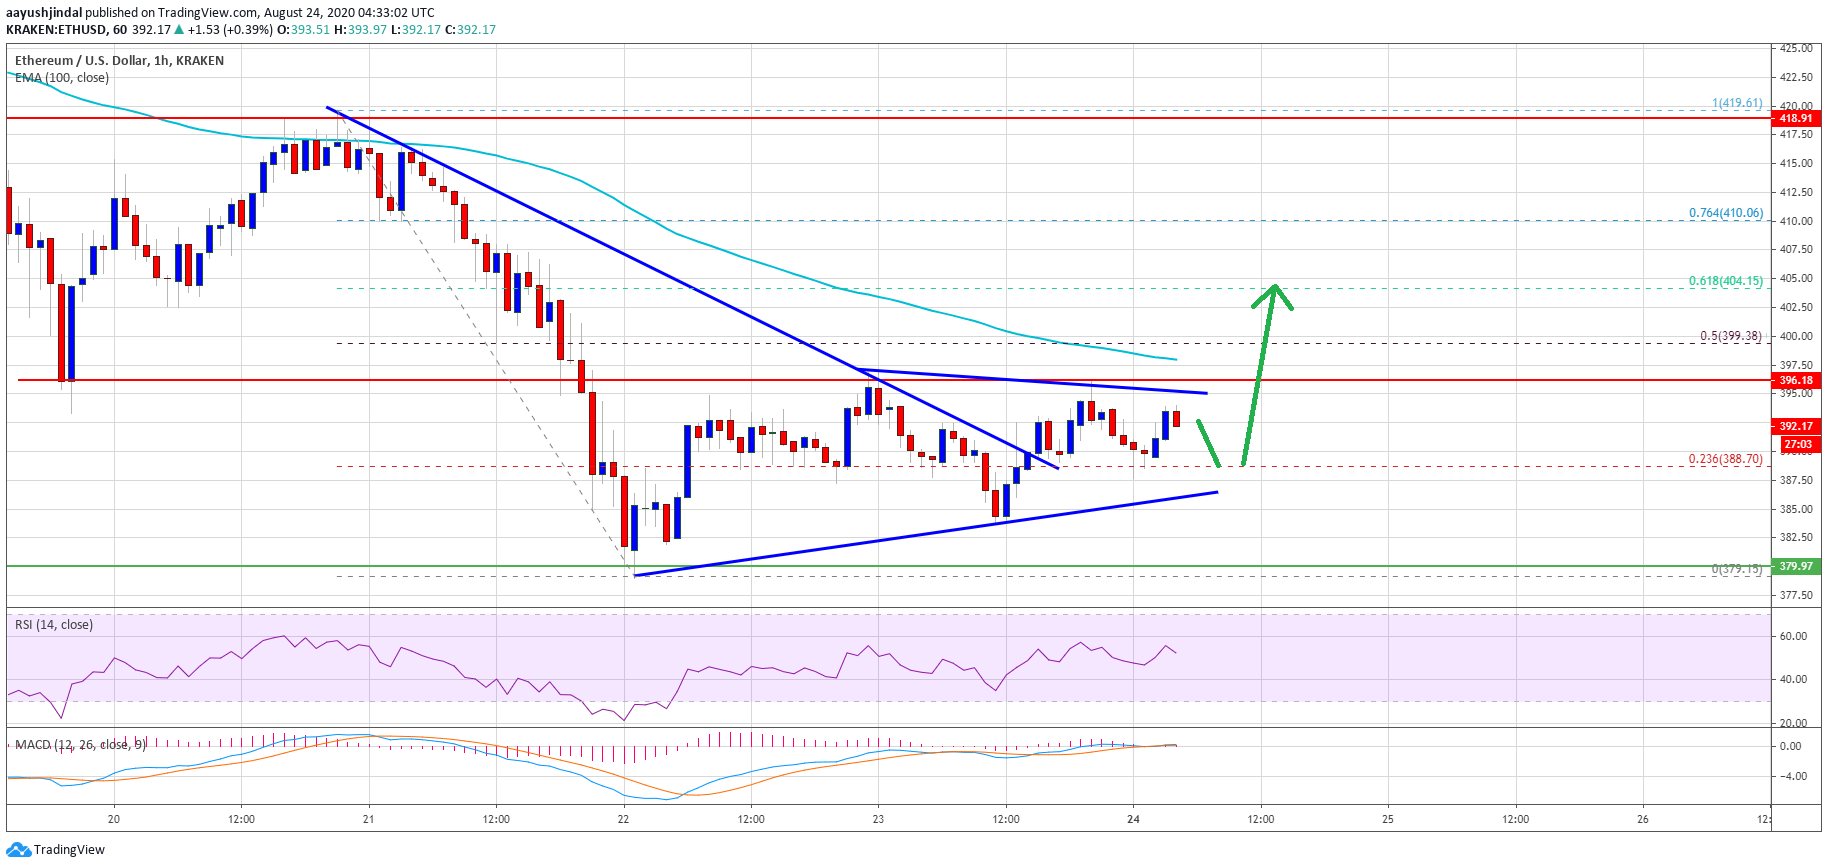
Ethereum is holding a crucial support zone near the $380 level against the US Dollar. ETH price seems to be basing for the next move and it might surge above $400 in the near term.
- Ethereum is currently consolidating above the $380 and $385 support levels.
- The price is likely to face hurdles near $395, $400, and the 100 hourly simple moving average.
- There is a key contracting triangle forming with resistance near $395 on the hourly chart of ETH/USD (data feed via Kraken).
- The pair could start a strong increase if it clears the $395 and $400 resistance levels.
Ethereum Price Approaching Next Break
Ethereum traded as low as $379 and recently started correcting losses against the US Dollar. ETH recovered above $385 and it seems like the price is forming a decent support base above $380.
There was a break above the $390 level, plus the 23.6% Fib retracement level of the downward move from the $20 swing high to $379 low. Moreover, ether price was able to climb above a key bearish trend line with resistance near $390 on the hourly chart.
The price is currently facing a strong resistance near the $395 level. There is also a key contracting triangle forming with resistance near $395 on the same chart of ETH/USD. The next key resistance is near the $400 level and the 100 hourly simple moving average.
Ethereum price trades above $390. Source: TradingView.com
The 50% Fib retracement level of the downward move from the $20 swing high to $379 low is also near $400. If ether surpasses the $395 and $400 resistance levels, it could start a steady rise.
A successful close above the $400 resistance level may perhaps lead the price towards the $420 resistance zone in the coming sessions.
Another Rejection for ETH?
If Ethereum fails to break the $395 and $400 resistance levels, it could decline again. An initial support is near the $390 level. The first major support could be near the triangle lower trend line at $388.
A downside break below the triangle support might push the price further lower towards $385. To move further into a bearish zone, the bears must push the price below the range support at $380.
Technical Indicators
Hourly MACD – The MACD for ETH/USD is slowly moving into the bullish zone.
Hourly RSI – The RSI for ETH/USD is currently well above the 50 level.
Major Support Level – $385
Major Resistance Level – $400


No comments: