Following a 157% bull rally throughout the first half of August that saw Chainlink hit a new all-time high of $20, this cryptocurrency entered a massive downtrend. As sell orders began to pile up, LINK took a 36% nosedive to reach a low of $12.8 on August 21.
Over the past few days, however, the decentralized oracles token has rebounded following a buy signal presented by the Tom Demark (TD) Sequential indicator.
TD Index Presents Buy Signal on LINK's Daily Chart. (Source: TradingView)
Although the bullish formation estimates a one to four daily candlesticks upswing, different on-chain metrics suggest a further downturn.
Chainlink’s Network Growth Declines
Since mid-August, market participants seem to be staying away from purchasing LINK tokens. This can be seen in the way the network has been shrinking since then.
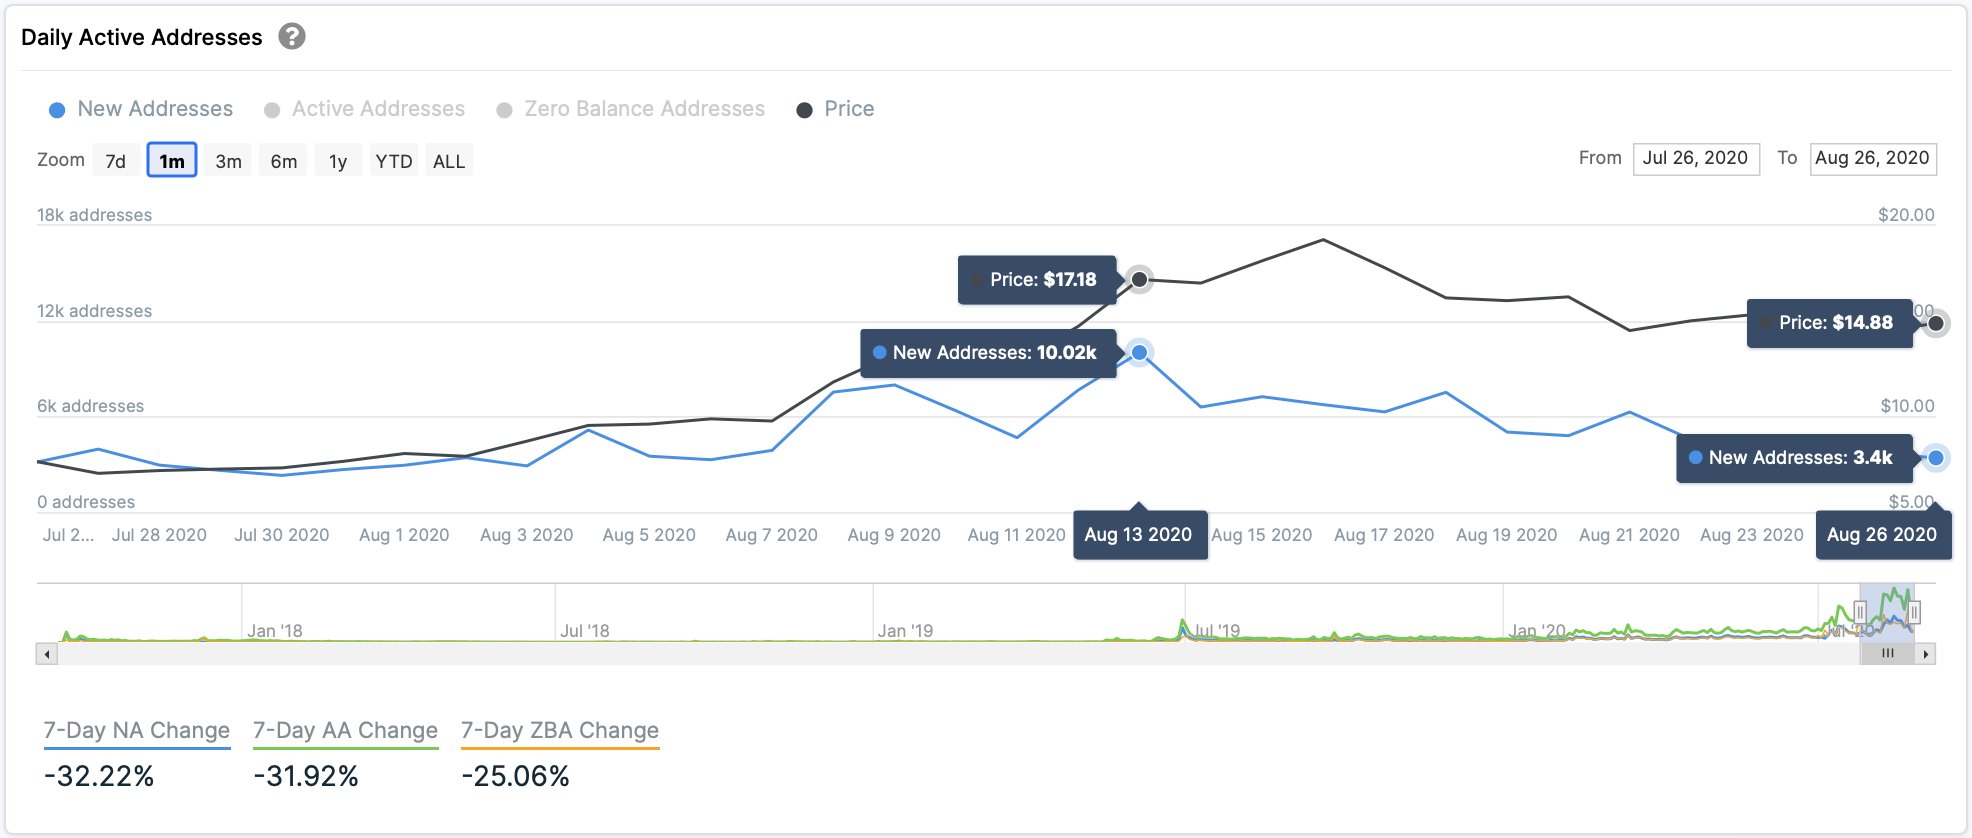
Roughly 10,000 new addresses were joining the network on a daily basis around August 13. Now, the number of unique addresses has plummeted by 66%. Approximately 3,400 new daily addresses are currently being created, which can be seen as a significantly bearish signal.

Chainlink's New Daily Addresses Decline. (Source: IntoTheBlock)
Brian Quinlivan, marketing and social media director at Santiment, believes that network growth is “one of the most accurate price foreshadowers.” The increase or decline in user adoption over time can help observers understand the health and well being of any given cryptocurrency.
“Generally, a rising network growth leads to a rising price of any project over time, in most cases. On the flip side, declining network growth for a long enough stretch can usually indicate a future slumping price with the lack of newly created addresses constantly in-flowing the coin or token,” said Quinlivan.
Given the current rate at which Chainlink’s network is shrinking, it is reasonable to assume that its price may have more room to go down. However, there is a major supply barrier underneath the decentralized oracles token that may have the ability to hold falling prices at bay.
Stiff Price Support Ahead
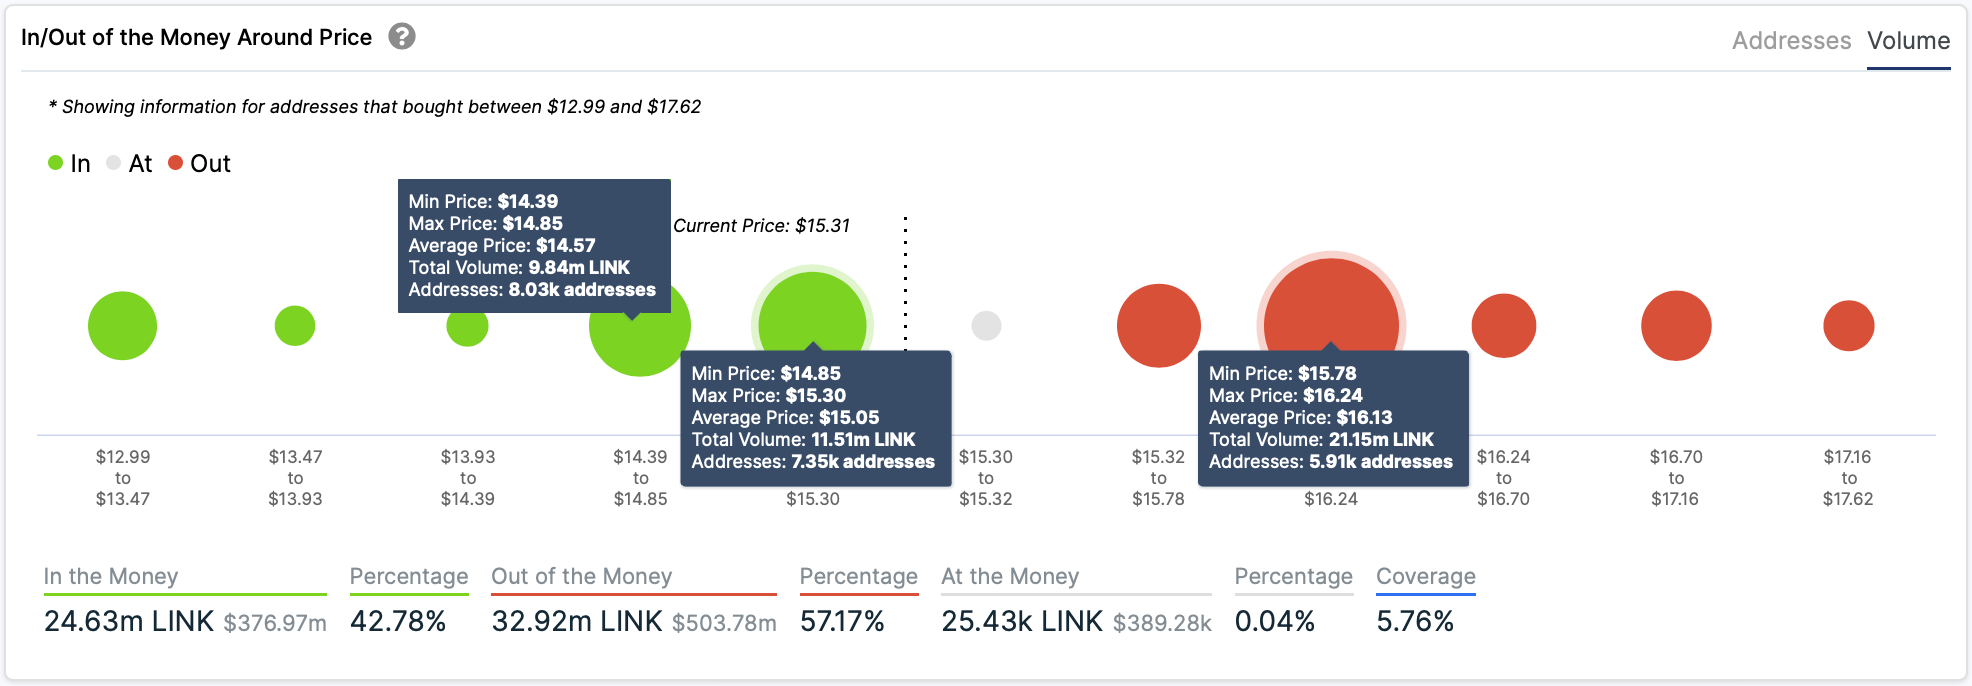
In the event of a correction, IntoTheBlock’s “In/Out of the Money Around Price” (IOMAP) model reveals there is a critical support level ahead of Chainlink. Based on the IOMAP cohorts, nearly 15,400 addresses had previously purchased more than 21.3 million LINK between $15.3 and $14.4.
Such an important supply barrier may have the ability to absorb some of the selling pressure. If prices fall to this level, holders who have been sitting in profits on their positions may avoid seeing their investments go into the red. They may even buy more tokens to allow prices to rebound.

LINK Faces Stiff Support and Resistance. (Source: IntoTheBlock)
On the flip side, the IOMAP shows that Chainlink sits underneath stiff resistance. Roughly 6,000 addresses are holding over 21 million LINK between $15.8 and $16.2. This crucial area of interest indicates that bulls will struggle to push prices further up. As a result, the next major price movement will depend on a break of any of these levels.
Featured Image by Unsplash
Price tags: linkusd, linkusdt, linkbtc
Chart from TradingView.com

No comments: