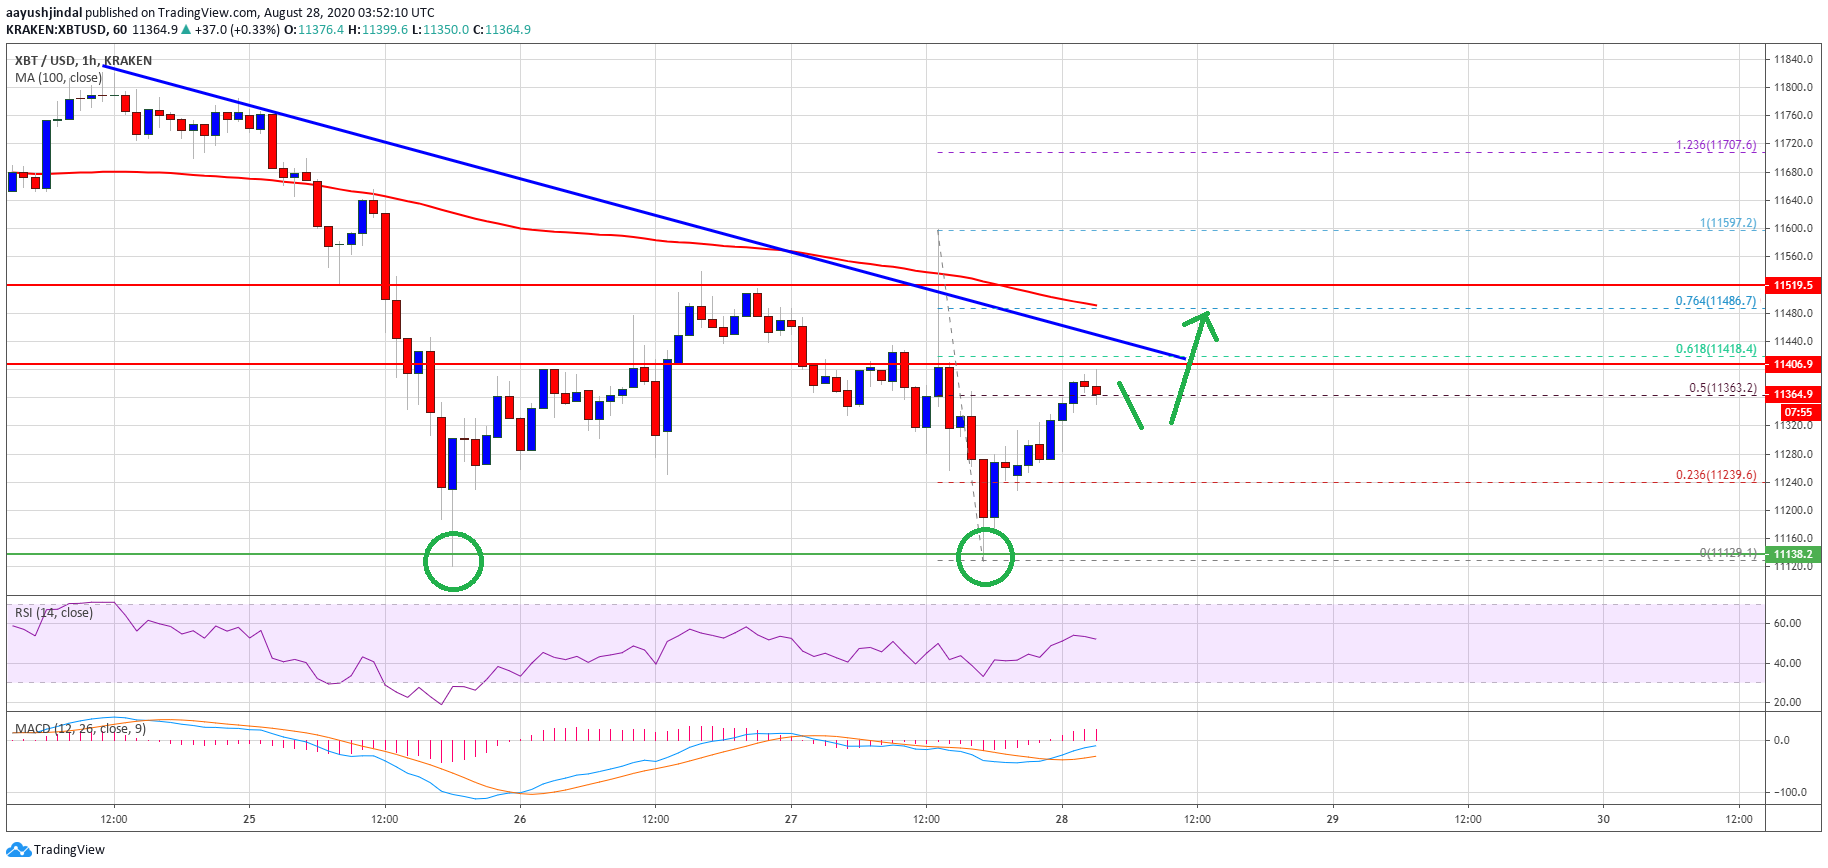
Bitcoin price is forming a strong support and a possible double bottom near $11,140 against the US Dollar. BTC is likely to rally if it clears the $11,500 resistance.
- Bitcoin is showing a few positive signs above the $11,140 and $11,200 support levels.
- The price is still struggling to clear the $11,500 resistance and the 100 hourly simple moving average.
- There is a crucial bearish trend line forming with resistance near $11,420 on the hourly chart of the BTC/USD pair (data feed from Kraken).
- The pair is likely forming a strong support and a possible double bottom pattern near $11,140.
Bitcoin Price Forming A Bullish Breakout Pattern?
Yesterday’s fed drama and the US GDP release sparked strong moves in bitcoin price near $11,400 against the US Dollar. BTC climbed higher above $11,500 and the 100 hourly simple moving average.
However, it failed to gain momentum and quickly reversed gains to trade below $11,400. It even broke the $11,200 level and revisited the last swing low zone and support near $11,140.
The bulls were able to defend more losses below $11,140 and the price started a fresh increase. It seems like there is likely forming a strong support and a possible double bottom pattern near $11,140. Bitcoin is now trading above $11,300, and the 50% Fib retracement level of the recent decline from the $11,597 high to $11,129 low.
Bitcoin price trades above $11,350. Source: TradingView.com
On the upside, the price is still struggling to clear the $11,500 resistance and the 100 hourly simple moving average. There is also a crucial bearish trend line forming with resistance near $11,420 on the hourly chart of the BTC/USD pair.
The trend line is close to the 61.8% Fib retracement level of the recent decline from the $11,597 high to $11,129 low. If there is a successful close above the $11,400 and $11,500 resistance levels, the price is likely to start a strong rally. The next major resistance is near the $11,800 level, above which bitcoin could revisit $12,000.
Another Failure in BTC?
If bitcoin fails to continue higher above the $11,400 and $11,500 levels, there could be another bearish reaction. The first major support is near the $11,280 and $11,250 levels.
The main support is now forming near the $11,140 level, below which the double bottom pattern will invalidate and the price might dive towards $10,800.
Technical indicators:
Hourly MACD – The MACD is now gaining pace in the bullish zone.
Hourly RSI (Relative Strength Index) – The RSI for BTC/USD is now moving nicely above the 50 level.
Major Support Levels – $11,280, followed by $11,140.
Major Resistance Levels – $11,400, $11,500 and $11,550.


No comments: