- Ripple price is currently correcting higher and is trading above $0.2520 against the US dollar.
- The price seems to be approaching a major resistance area near the $0.2600 level.
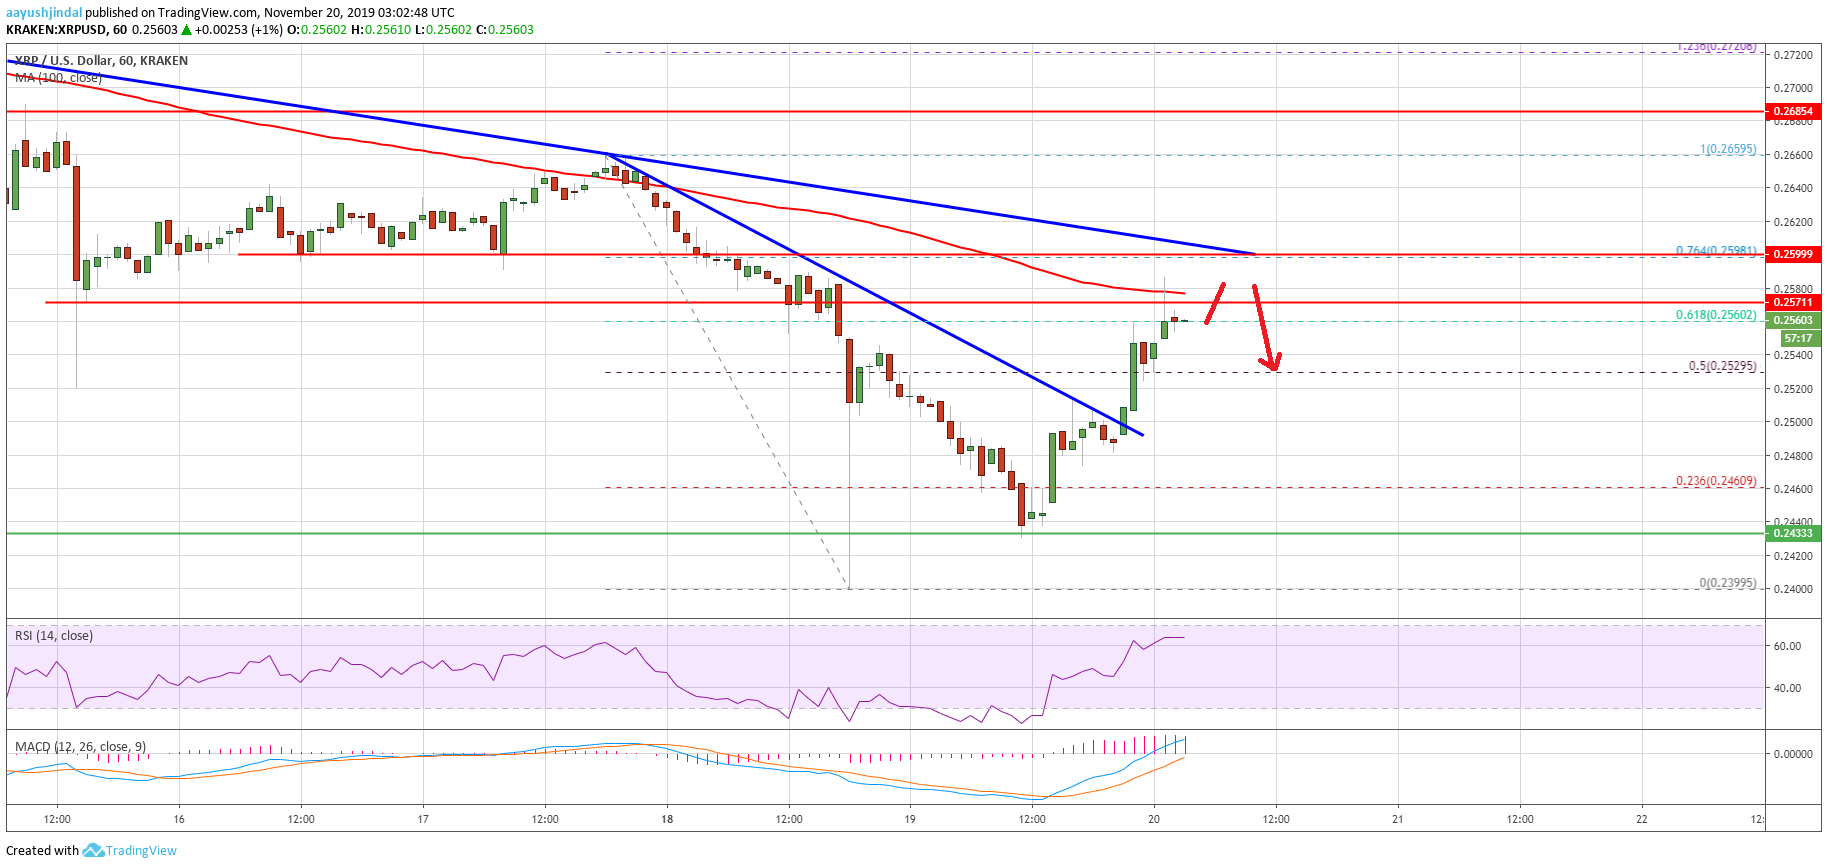
- This week’s crucial bearish trend line is intact with resistance near $0.2600 on the hourly chart of the XRP/USD pair (data source from Kraken).
- Ethereum is also correcting higher, but it is likely to face resistance near $180.
Ripple price is gaining bullish momentum against the US Dollar and bitcoin. However, XRP price must break the $0.2600 resistance to move into a positive zone.
Ripple Price Analysis
This week, we saw a sharp decline in ripple below the $0.2500 support area against the US Dollar. Moreover, XRP/USD broke the $0.2450 support area and settled well below the 100 hourly simple moving average.
Finally, the price tested the $0.2400 support area and recently started an upside correction. It broke the $0.2450 and $0.2480 levels to start the current correction wave. Besides, there was a break above a connecting bearish trend line with resistance near $0.2500 on the hourly chart of the XRP/USD pair.
Ripple is now trading above the 50% Fib retracement level of the downward move from the $0.2660 high to $0.2400 swing low. On the upside, there is a strong resistance near the $0.2580 level and the 100 hourly simple moving average.
Additionally, the 61.8% Fib retracement level of the downward move from the $0.2660 high to $0.2400 swing low seems to be preventing gains. The main resistance on the upside is near the $0.2600 level.
More importantly, this week’s crucial bearish trend line is intact with resistance near $0.2600 on the same chart. Therefore, a clear break above the $0.2580 and $0.2600 resistance levels might push the price back into a bullish zone.
In the mentioned bullish scenario, the price is likely to rise towards the $0.2720 and $0.2750 resistance levels. Conversely, the price may perhaps struggle to break the $0.2600 resistance and it could start a fresh decline.
An initial support is near the $0.2520 level, followed by $0.2500. Any further losses might lead the price back towards the $0.2400 support area in the near term.
Looking at the chart, ripple price is nicely correcting above the $0.2520 resistance. Having said that, the bulls are clearly facing an uphill task near the $0.2580 and $0.2600 resistance levels. If they fail to gain momentum above $0.2600, the price could resume its decline.
Technical Indicators
Hourly MACD – The MACD for XRP/USD is now losing momentum in the bullish zone.
Hourly RSI (Relative Strength Index) – The RSI for XRP/USD is currently correcting lower towards 55 or 50.
Major Support Levels – $0.2520, $0.2450 and $0.2400.
Major Resistance Levels – $0.2580, $0.2600 and $0.2685.
The post Ripple (XRP) Price Trading Near Crucial Juncture, Can Bulls Make It? appeared first on NewsBTC.


No comments: