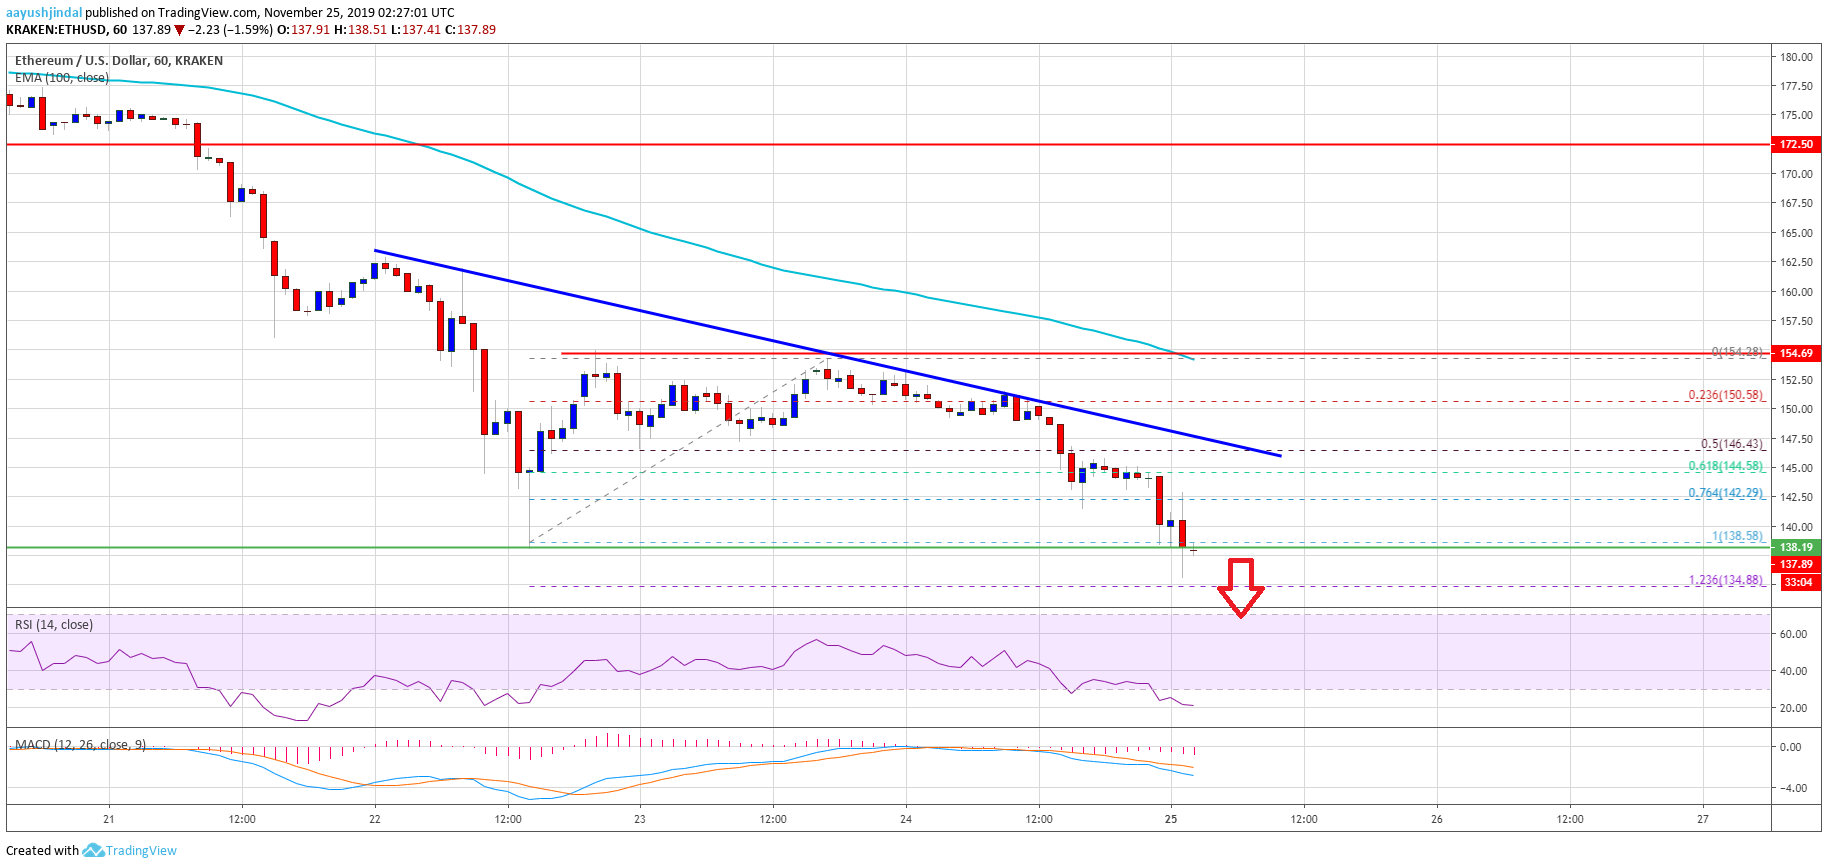
- Ethereum is declining and it recently failed to recover above the $155 resistance against the US Dollar.
- Bitcoin price is now trading well below the $7,000 level and tested the final $6,500 bearish target.
- There is a key bearish trend line forming with resistance near $147 on the hourly chart of ETH/USD (data feed via Kraken).
- The price is currently trading below $145 and it is likely to trade below the $135 support area.
Ethereum price is facing an increase in selling versus the US Dollar, similar to bitcoin. ETH remains at a risk of a drop towards the $125 support area.
Ethereum Price Analysis
In the weekly forecast, we discussed the chances of another breakdown below $145 in Ethereum against the US Dollar. ETH price remained in a bearish zone, failed to climb above the $155 resistance, and settled well below the 100 hourly simple moving average.
As a result, there was a downside break below the $145 support area. The decline was such that the price broke the 76.4% Fib retracement level of the recent recovery from the $138 low to $155 high.
Moreover, the price spiked below the $138 low and it is currently struggling to recover. An immediate support is near the $135 level. It represents the 1.236 Fib extension level of the recent recovery from the $138 low to $155 high.
If there are more downsides, the price is likely to test the $130 support area. Any further losses may perhaps push Ethereum towards the $125 support area in the near term. An intermediate support is near the 1.618 Fib extension level of the recent recovery from the $138 low to $155 high.
On the upside, there are many resistances, starting with $142. Additionally, there is a key bearish trend line forming with resistance near $147 on the hourly chart of ETH/USD.
To start a decent recovery, the price must clear the $142 and $147 resistance levels. However, the main resistance is still near the $155 level and the 100 hourly simple moving average, above which there are high chances of a trend change from bearish to bullish.
Looking at the chart, Ethereum price is declining and likely to trade towards the $135 and $130 support levels. The key support zone could be $125, where the bulls are likely to put up a strong fight in the near term.
ETH Technical Indicators
Hourly MACD – The MACD for ETH/USD is currently gaining momentum in the bearish zone.
Hourly RSI – The RSI for ETH/USD is currently declining and it is well near the oversold levels.
Major Support Level – $135
Major Resistance Level – $147
The post Ethereum (ETH) Downtrend Gaining Pace, $125 Next? appeared first on NewsBTC.


No comments: