- Bitcoin price is consolidating losses above the $8,000 support area against the US Dollar.
- The price is likely to struggle near the $8,150 and $8,220 resistance levels.
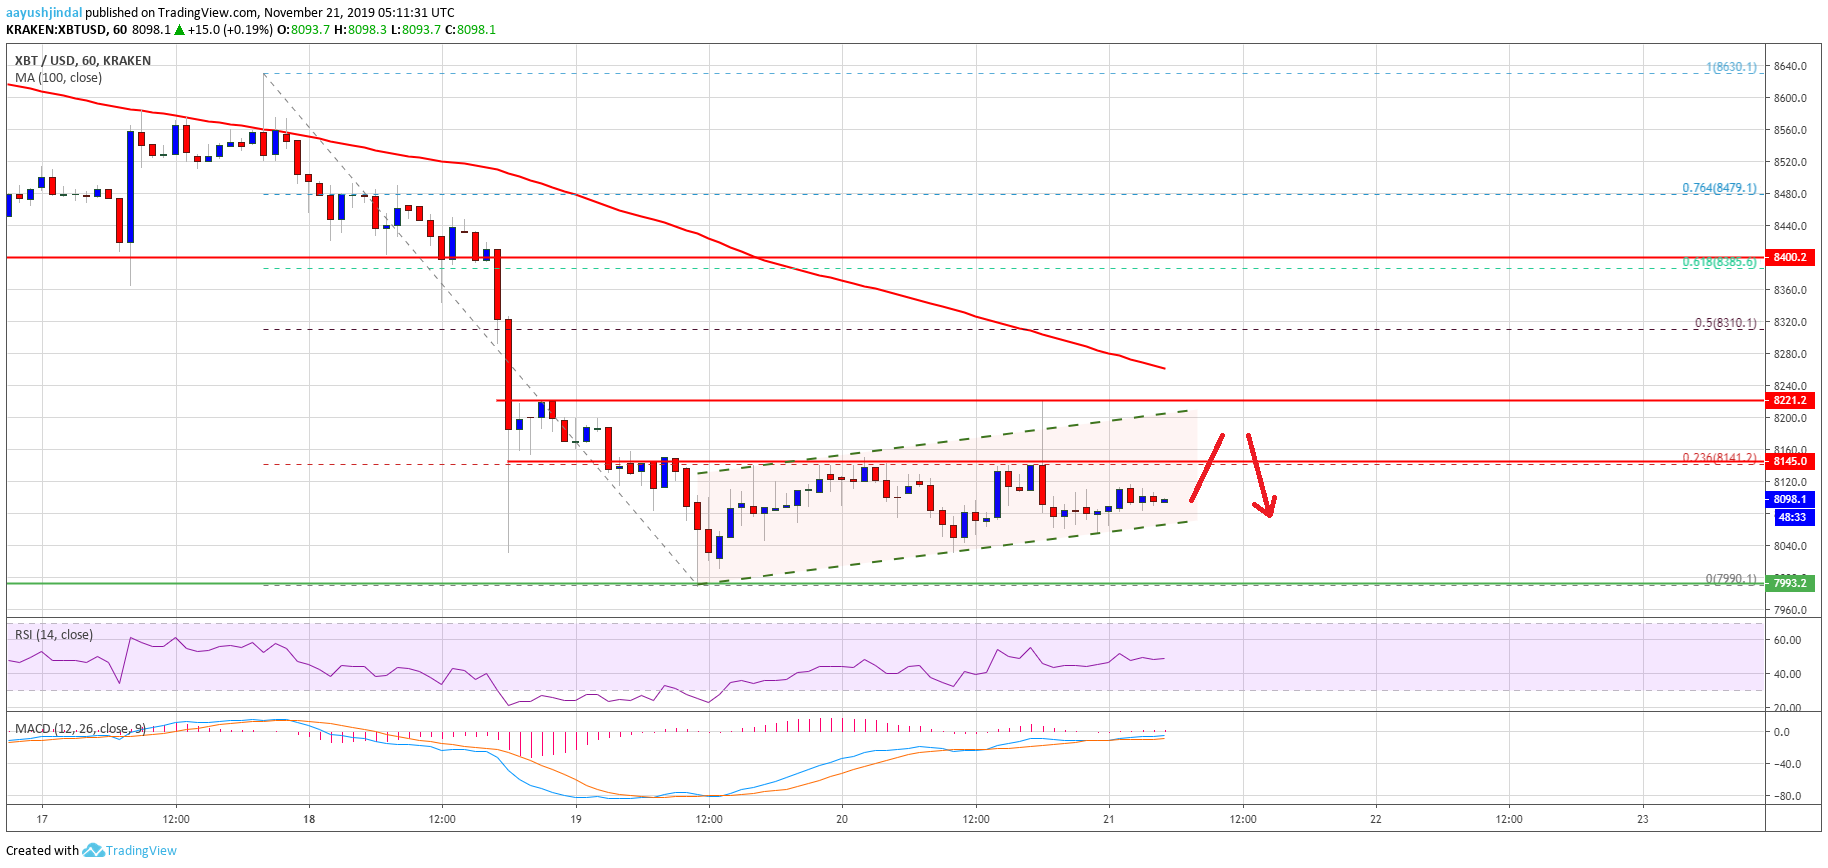
- There is a key rising channel or a bearish flag pattern forming with support near $8,060 on the hourly chart of the BTC/USD pair (data feed from Kraken).
- An upside correction towards the $8,220 and $8,280 levels could face a solid selling interest.
Bitcoin price is consolidating losses with corrective moves against the US Dollar. However, BTC remains sell on rallies if it climbs towards $8,220 and $8,280.
Bitcoin Price Analysis
After a nasty decline, bitcoin found support near the $8,000 level against the US Dollar. BTC traded as low as $7,990 and it is currently consolidating losses well below the 100 hourly simple moving average.
There was a corrective wave above the $8,080 and $8,100 levels. Moreover, the price spiked above the $8,150 resistance level. Though, the price struggled to stay above the 23.6% Fib retracement level of the downward move from the $8,630 high to $7,990 low.
At the outset, the price is trading near $8,100, with an immediate resistance near the $8,150 level. Additionally, the next key resistance is near the $8,200 and $8,220 levels, above which bitcoin could test the $8,300 resistance area.
An intermediate resistance is near the $8,280 level and the 100 hourly simple moving average. To move into a positive zone, the price must settle above the $8,300 resistance and the 100 hourly SMA.
Besides, the 50% Fib retracement level of the downward move from the $8,630 high to $7,990 low is also near the $8,310 level to act as a resistance.
Conversely, the price could struggle to climb above the $8,150 and $8,220 resistance levels. On the downside, an initial support is near the $8,060 level. More importantly, there is a key rising channel or a bearish flag pattern forming with support near $8,060 on the hourly chart of the BTC/USD pair.
Therefore, a downside break below the channel support near $8,060 will most likely push the price further lower. Finally, a bearish break below the $8,000 support area could open the doors for a drop towards the $7,400 support area (the next bearish target as discussed in the recent medium term outlook).
Looking at the chart, bitcoin price is likely forming anther breakdown pattern with support near $8,060 and $8,000. On the other hand, the bulls need to gain momentum above $8,220 and $8,300 to negate the current bearish view.
Technical indicators:
Hourly MACD – The MACD is struggling to move into the bullish zone.
Hourly RSI (Relative Strength Index) – The RSI for BTC/USD is currently flat below the 50 level.
Major Support Levels – $8,060 followed by $8,000.
Major Resistance Levels – $8,150, $8,220 and $8,300.
The post Bitcoin (BTC) Price Hesitates But Further Downsides Seem Likely appeared first on NewsBTC.


No comments: