
- ETH price broke the main $185 resistance and climbed above $190 against the US Dollar.
- Bitcoin price is consolidating above the $10,300 support area, with positive signs.
- There is a connecting bullish trend line forming with support near $188 on the hourly chart of ETH/USD (data feed via Kraken).
- The pair is likely to continue higher and it might soon test the $200 resistance area in the near term.
Ethereum price is climbing above $190 versus the US Dollar and recovering vs bitcoin. ETH price is showing positive signs and it might continue to rise towards $200-$205.
Ethereum Price Analysis
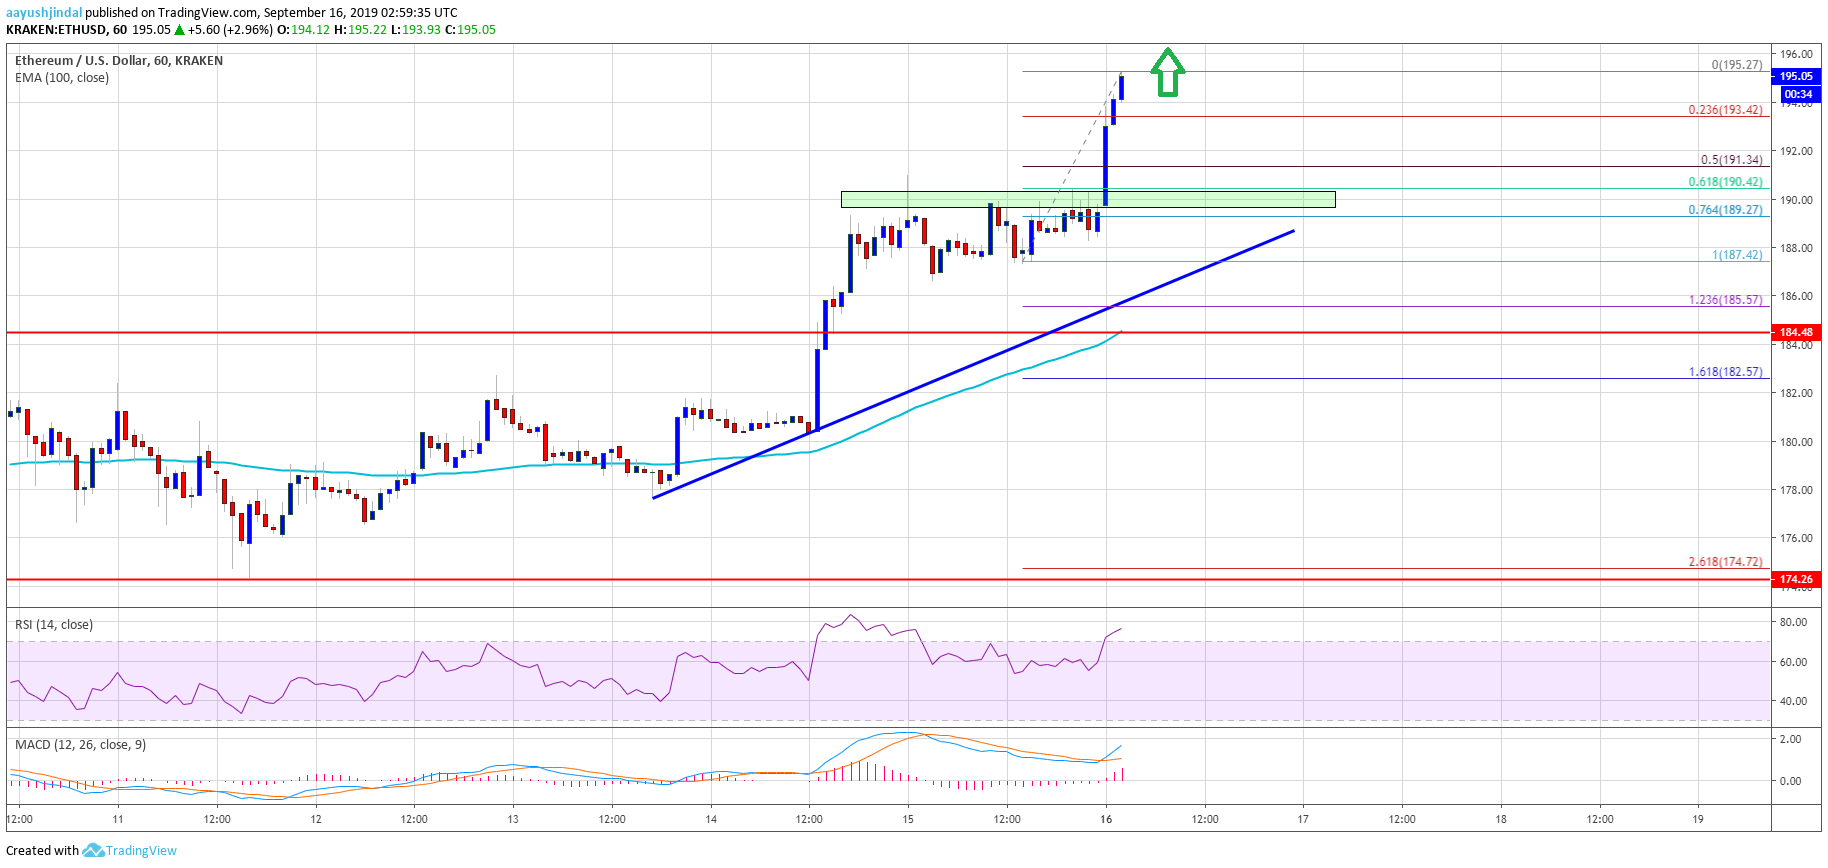
In the past analysis, we discussed the chances of an upside break in ETH price above the $185 resistance against the US Dollar. The price did gain traction and broke the main $185 and $186 resistance levels. Moreover, there was a close above $185 and the 100 hourly simple moving average. It opened the doors for more gains above the $190 level. On the other hand, bitcoin price remained in a range above the $10,300 level.
Ethereum price even broke the $192 level and traded to a new weekly high at $195. The current price action indicates more gains above the $195 level. If there is a downside correction, an initial support is near the $193 level. It coincides with the 23.6% Fib retracement level of the recent upward move from the $187 swing low to $195 high.
However, the main support on the downside is near the $190 level. It represents the 50% Fib retracement level of the recent upward move from the $187 swing low to $195 high. Additionally, there is a connecting bullish trend line forming with support near $188 on the hourly chart of ETH/USD. Therefore, if there is a downside correction, the price is likely to find buyers near $190 or $188.
On the upside, a convincing break above the $195 level could open the doors for a push towards the $200 resistance level. However, the main resistance is near the $205 level (the previous support), above which the price could surge towards $220.
Looking at the chart, Ethereum price is trading with a strong bullish bias above the $190 level. If the price remains above the $190 level for a couple of sessions, there are high chances of a run towards the $200 and $205 levels. If not, the price may perhaps extend the correction towards $188 or $185.
ETH Technical Indicators
Hourly MACD – The MACD for ETH/USD is currently gaining momentum in the bullish zone.
Hourly RSI – The RSI for ETH/USD is currently climbing higher and it is well above the 70 level.
Major Support Level – $190
Major Resistance Level – $195
The post Ethereum Price (ETH) Surging While Bitcoin Trading Sideways appeared first on NewsBTC.
No comments: