- Ripple price is following a bearish path below the $0.2800 and $0.2900 resistances against the US dollar.
- There are many supports on the downside such as $0.2640, $0.2580 and $0.2500.
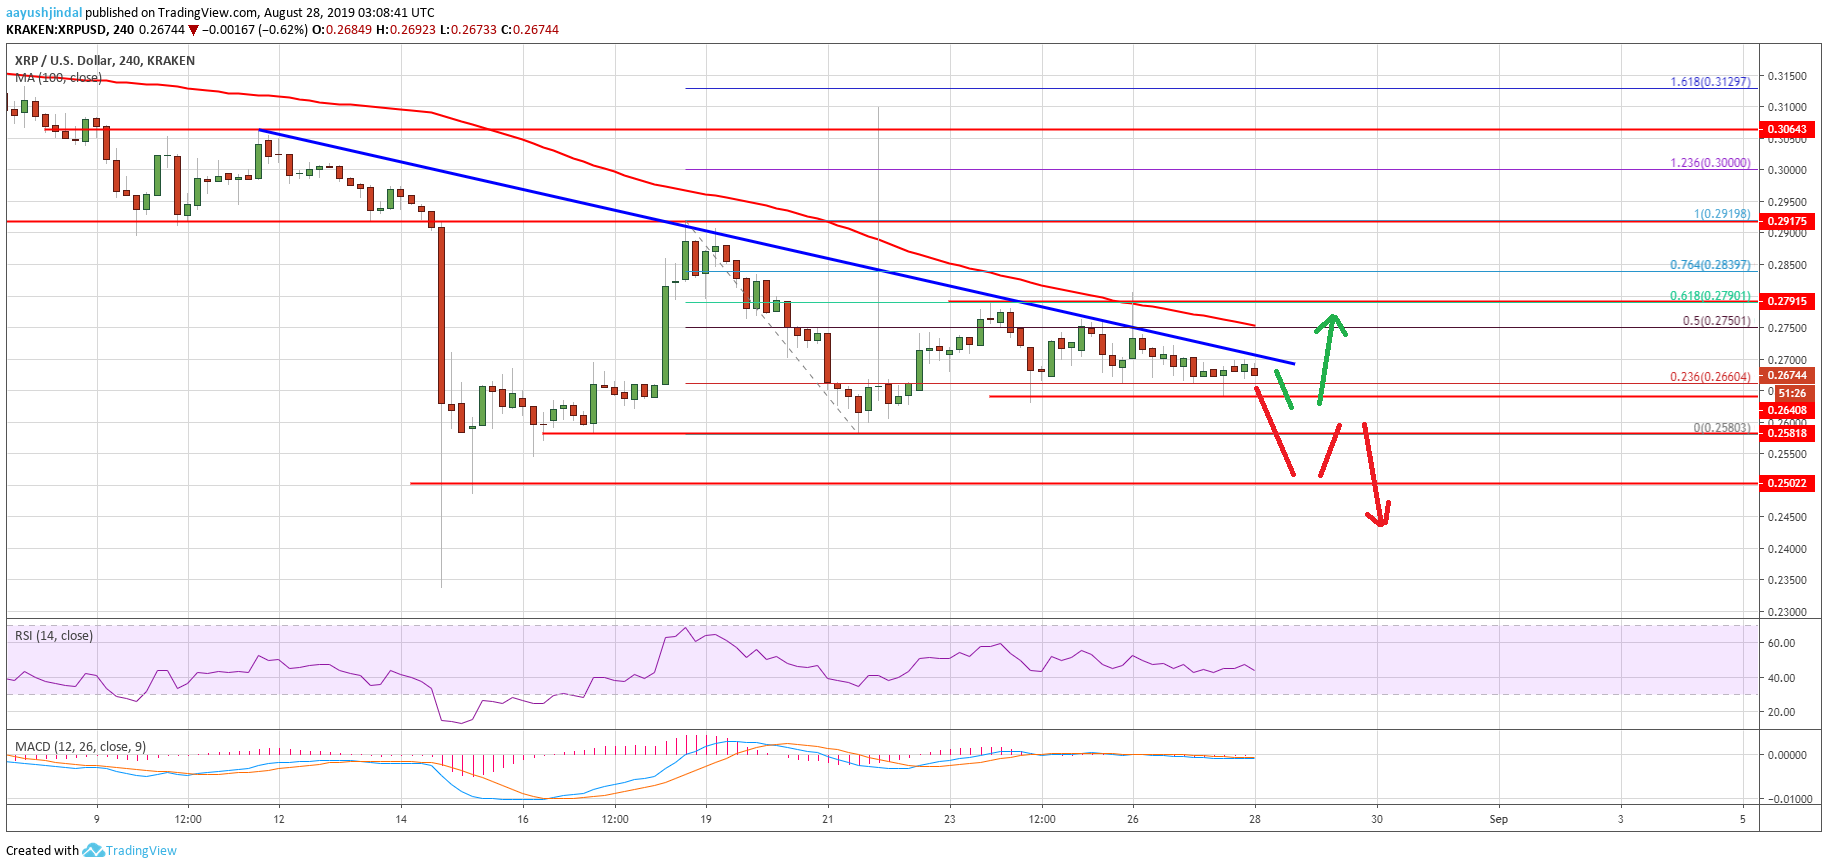
- There is a crucial bearish trend line forming with resistance near $0.2700 on the 4-hours chart of the XRP/USD pair (data source from Kraken).
- The price could either climb above $0.2800 or decline heavily below $0.2500 in the near term.
Ripple price is facing a lot of hurdles against the US Dollar and bitcoin. XRP price seems to be preparing for a larger wave either above $0.2800 or below $0.2500.
Ripple Price Analysis
In the past few days, there was a slow and steady decline in bitcoin, Ethereum and XRP against the US Dollar. After testing the key $0.2900 and $0.2920 resistance levels, ripple started a fresh decline. It broke the $0.2800 support level to move back into a bearish zone. Moreover, there was a close below the $0.2750 level and the 100 simple moving average (4-hours).
It opened the doors for more downsides below the $0.2650 support. Finally, the price tested the $0.2580 level and traded as low as $0.2581. Later, the price started an upside correction above the $0.2650 and $0.2700 level. Moreover, there was a break above the 50% Fib retracement level of the major decline from the $0.2919 high to $0.2580 low.
However, the upward move was capped by the $0.2800 resistance level. Additionally, the 61.8% Fib retracement level of the major decline from the $0.2919 high to $0.2580 low acted as a strong resistance. More importantly, there is a crucial bearish trend line forming with resistance near $0.2700 on the 4-hours chart of the XRP/USD pair. Ripple is now following a bearish path below the $0.2800 and $0.2900 resistances.
There are two possible scenarios – bullish above $0.2800 or bearish below $0.2500. If there is an upside break above $0.2800 and $0.2900, the price could start a strong upward move. The next stops for the bulls might be $0.2920, $0.3000 and $0.3120. Conversely, a downside break below $0.2580 and $0.2500 could accelerate losses in the coming days.
Looking at the chart, ripple price is clearly struggling to gain bullish momentum above $0.2750 and $0.2800. However, there are many supports near $0.2580 and $0.2500. Overall, the next key break is near and the price could either surge or decline heavily below $0.2500.
Technical Indicators
Hourly MACD – The MACD for XRP/USD is slowly moving into the bearish zone.
Hourly RSI (Relative Strength Index) – The RSI for XRP/USD is currently below 50 and is moving lower towards 40.
Major Support Levels – $0.2640, $0.2580 and $0.2500.
Major Resistance Levels – $0.2750, $0.2800 and $0.2920.
The post Ripple Price (XRP) Possible Scenarios and Bigger Picture appeared first on NewsBTC.


No comments: