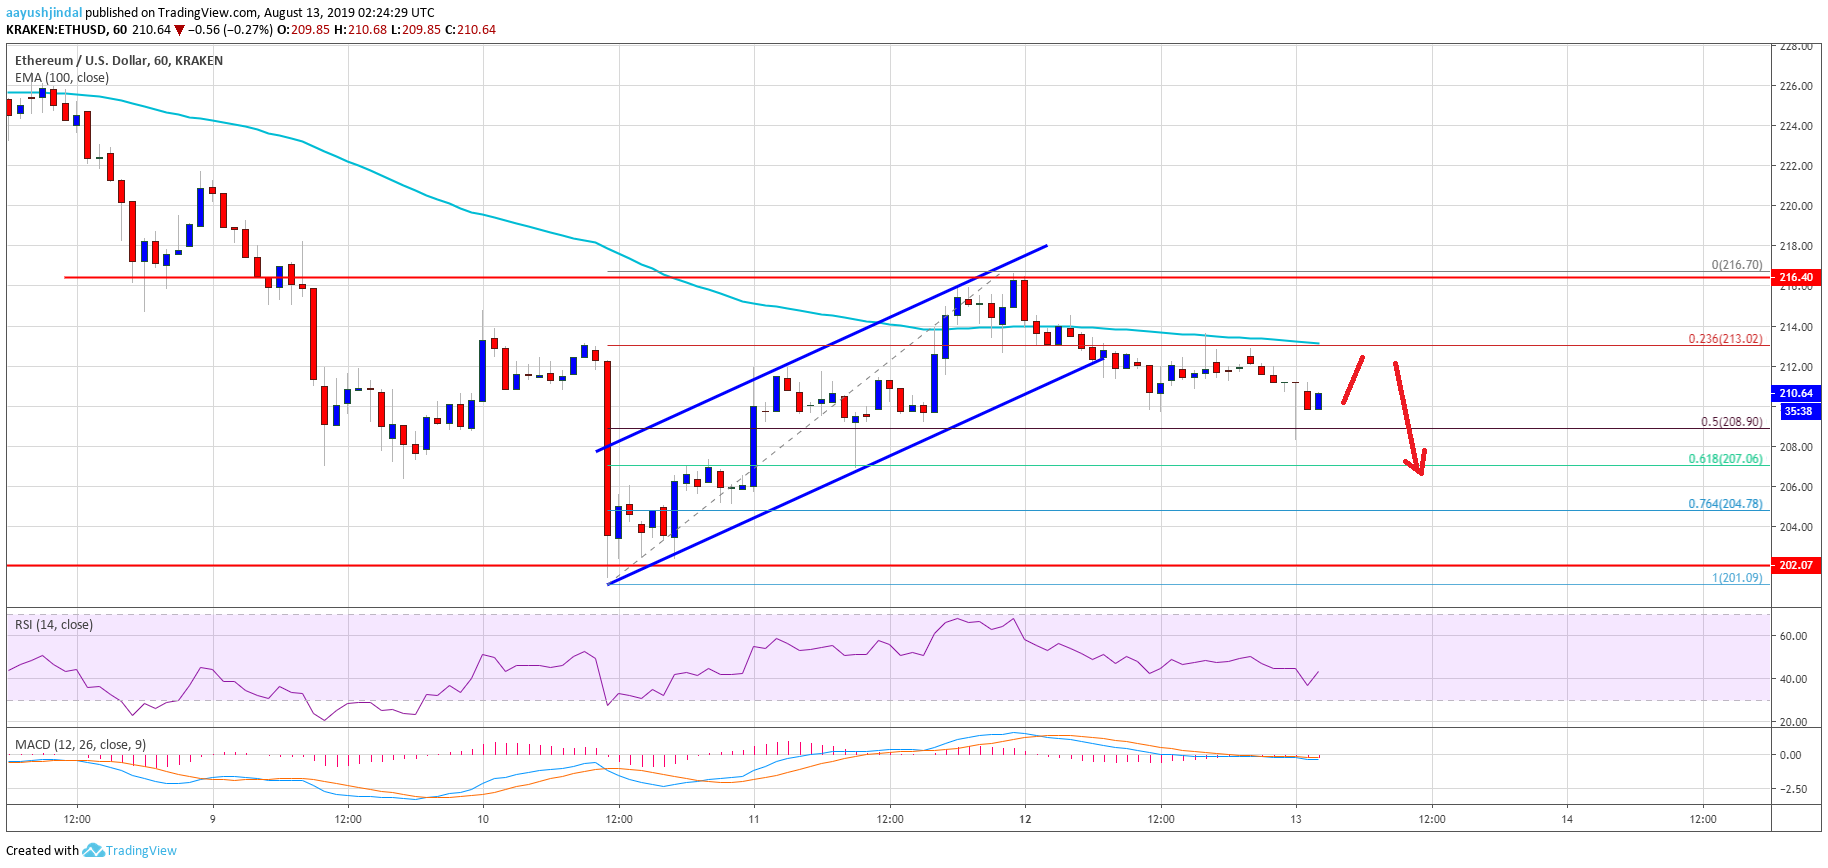
- ETH price failed to surpass the key $215 resistance area and declined again against the US Dollar.
- Ethereum price is now trading below the $214 level with a bearish angle.
- Yesterday’s highlighted key ascending channel with support near $213 was breached on the hourly chart of ETH/USD (data feed via Kraken).
- The pair is likely to extend its decline towards the $200 support area in the near term.
Ethereum price is trading in a bearish zone versus the US Dollar and bitcoin. ETH price could continue to slide and it seems like the price might even break $200.
Ethereum Price Analysis
Yesterday, we saw an upside correction in ETH price above the $210 resistance against the US Dollar. Bitcoin price also recovered above $11,400, but it failed to gain momentum above the $11,500 resistance. Ether’s price topped near the $215 and $216 resistance levels and recently moved low. Moreover, the price failed to clear the 61.8% Fib retracement level of the decline from the $226 high to $201 swing low.
The recent decline was such that the price broke the $214 support and the 100 hourly simple moving average. Additionally, there was a break below the 23.6% Fib retracement level of the recovery from the $201 low to $216 swing high. More importantly, yesterday’s highlighted key ascending channel with support near $213 was breached on the hourly chart of ETH/USD.
The price tested the $209 level, which represents the 50% Fib retracement level of the recovery from the $201 low to $216 swing high. If there are further losses, the price could test the $205 support level. The main support on the downside is near the $200 and $201 levels. If the bears succeed in pushing the price below $200, there could be heavy losses in the near term.
On the upside, an immediate resistance is near the $214 level and the 100 hourly SMA. The main resistance is near the $216 area. A successful break above the $216 area is likely to open the doors for decent gains in the coming sessions. The next resistance on the upside is near the $220 area.
Looking at the chart, Ethereum price seems to be trading in a bearish zone below the $215 and $216 levels. Therefore, there is a risk of more downsides below the $208 and $205 levels. Furthermore, if the $200 support fails to hold losses, the bulls might come under a lot of pressure in the near term.
ETH Technical Indicators
Hourly MACD – The MACD for ETH/USD is still placed in the bullish zone.
Hourly RSI – The RSI for ETH/USD is currently recovering towards the 45 level.
Major Support Level – $208
Major Resistance Level – $216
The post Ethereum Price (ETH) Resumes Decline, Bears Eye Fresh Lows appeared first on NewsBTC.


No comments: