- Bitcoin price declined heavily in the past few sessions below $10,000 against the US Dollar.
- The price is currently correcting higher after it tested the $9,750 support area.
- There is a declining channel forming with resistance near $10,100 on the hourly chart of the BTC/USD pair (data feed from Kraken).
- The price could correct higher in the short term, but upsides are likely to remain capped near $10,100.
Bitcoin price is back in a bearish zone below $10,250 against the US Dollar. BTC is likely to extend its decline if it fails to recover above $10,250 and $10,400.
Bitcoin Price Analysis
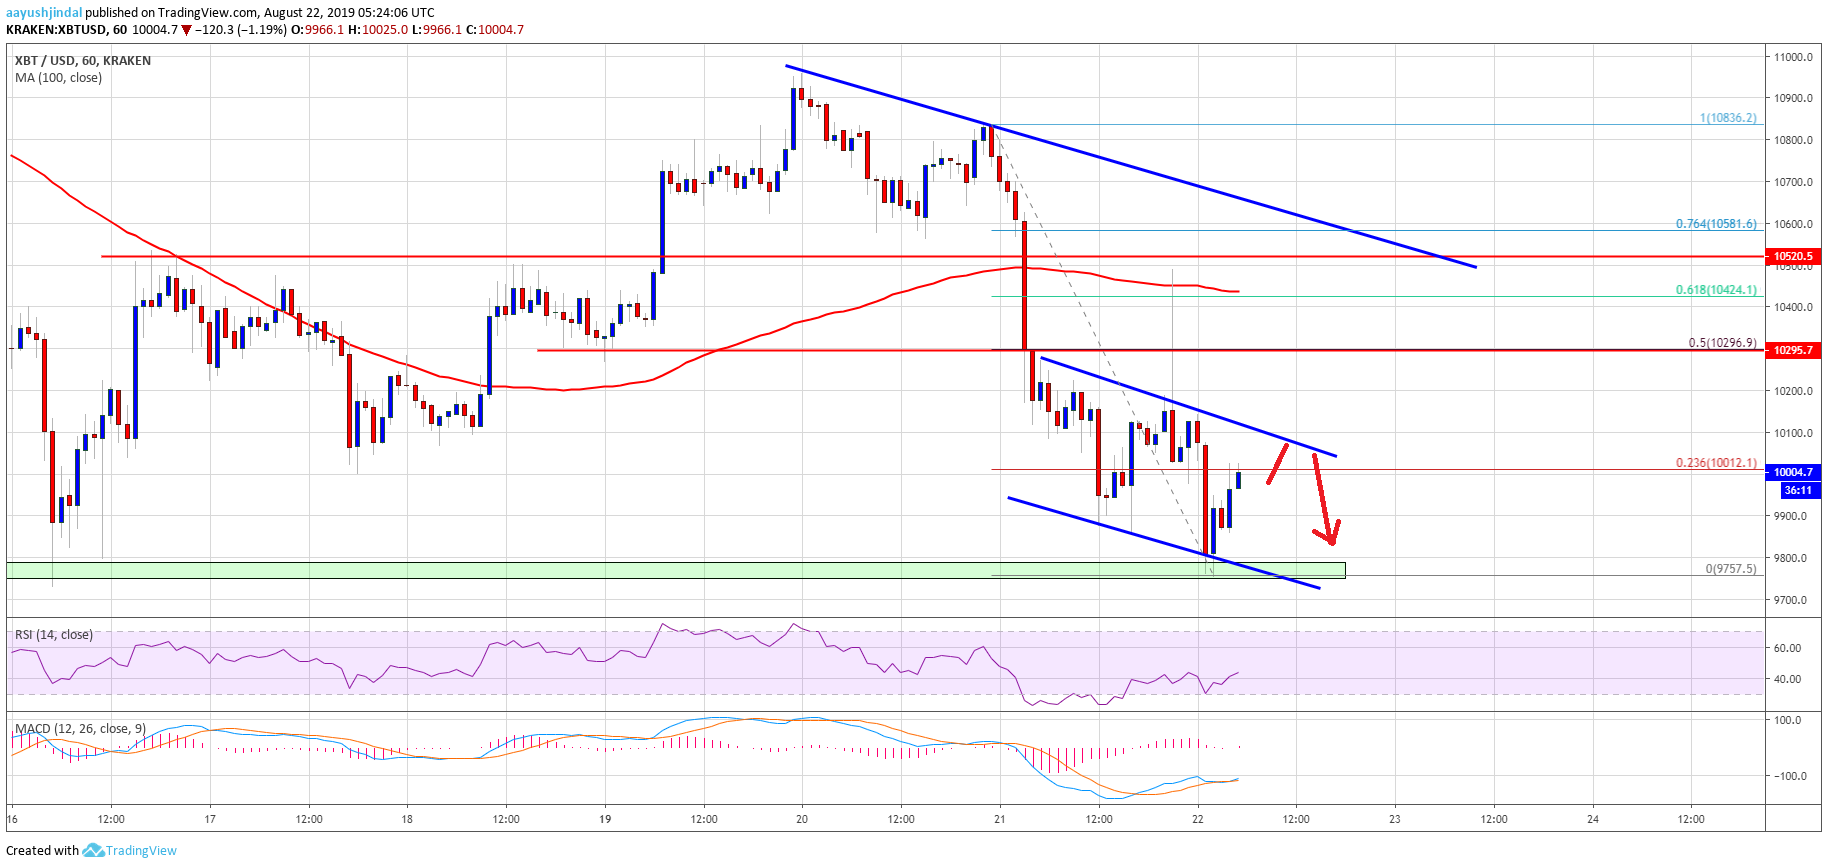
Yesterday, we saw a fresh decrease in BTC below the $10,250 support against the US Dollar. It opened the doors for more losses and the price declined below the $10,100 and $10,000 support levels. Moreover, there was a close below the $10,000 support and the 100 hourly simple moving average. The decline was such that the price broke the $9,800 support and tested the $9,750 level.
A swing low was formed near $9,757 and the price is currently correcting higher. It is testing the $10,000 resistance plus the 23.6% Fib retracement level of the recent decline from the $10,836 high to $9,757 low. However, there are many resistances on the upside near $10,100 and $10,200 levels. Additionally, there is a declining channel forming with resistance near $10,100 on the hourly chart of the BTC/USD pair.
If there is an upside break above the channel resistance, the price could correct higher towards the $10,250 and $10,300 resistance levels. The 50% Fib retracement level of the recent decline from the $10,836 high to $9,757 low is also near the $10,296 level to act as a strong resistance. Therefore, an upside correction towards $10,100 or $10,250 is likely to face a strong resistance.
If the price fails to correct above the $10,100 resistance or the $10,250 barrier, it could resume its decline. An immediate support is near the $9,750 level, below which the bears are likely to target the $9,500 support area. Moreover, an intermediate support is near the $9,620 level.
Looking at the chart, bitcoin price is clearly back in a bearish zone, with a close below $10,250 and the 100 hourly SMA. Therefore, to start a fresh increase, the bulls need to gain strength above $10,250 and $10,300. The next major resistance is near the $10,500 level and a connecting bearish trend line on the same chart.
Technical indicators:
Hourly MACD – The MACD is about to move back into the bearish zone.
Hourly RSI (Relative Strength Index) – The RSI for BTC/USD is currently recovering, but it is still well below 50.
Major Support Levels – $9,750 followed by $9,500.
Major Resistance Levels – $10,100, $10,250 and $10,300.
The post Bitcoin (BTC) Price Target Additional Weakness, Upsides Remain Capped appeared first on NewsBTC.


No comments: