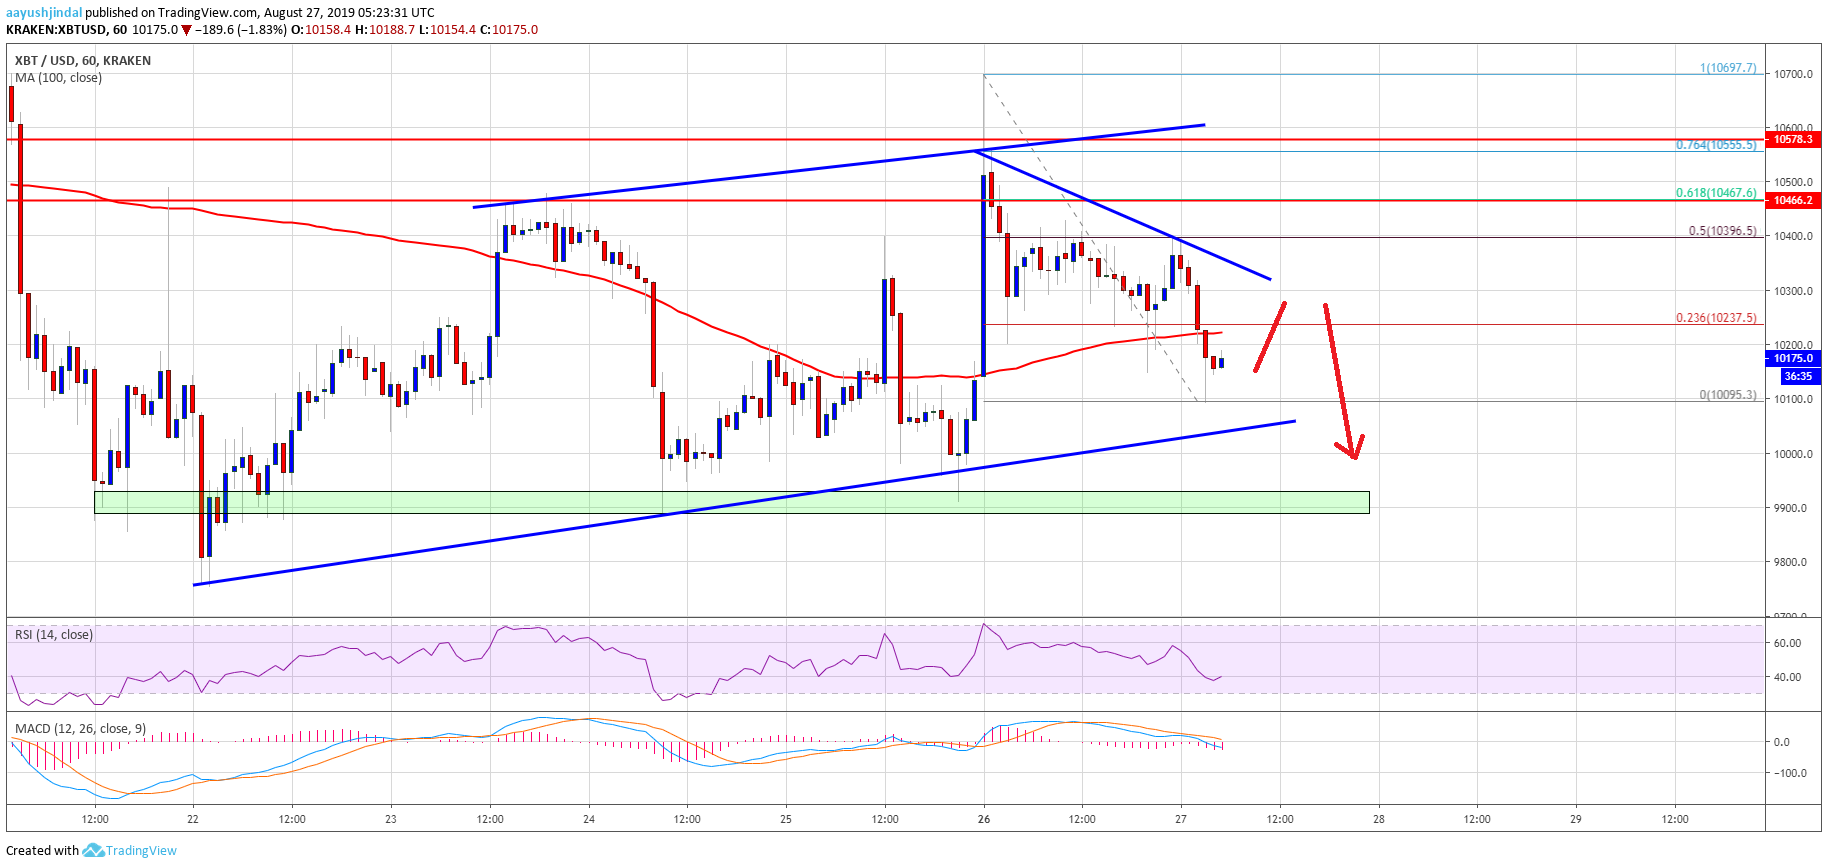
- Bitcoin price struggled to gain above $10,500 and declined below $10,300 against the US Dollar.
- The price is currently trading in a bearish zone below the $10,350 and $10,500 resistances.
- There is a rising channel or a bearish flag forming with support near $10,040 on the hourly chart of the BTC/USD pair (data feed from Kraken).
- The price could decline sharply if there is a downside break below the $10,000 support.
Bitcoin price is facing a lot of hurdles near $10,400 and $10,500 against the US Dollar. Therefore, BTC could continue to move down below $10,200 and $10,000.
Bitcoin Price Analysis
Yesterday, we saw a solid upward move in bitcoin above $10,250 against the US Dollar. The price even traded above the $10,400 level and the 100 hourly simple moving average. Finally, the price surpassed $10,500, but it struggled to retain gains. As a result, the price topped near $10,697 and later started a fresh decline. It broke the $10,500 and $10,400 levels to move back into a bearish zone.
Moreover, there was a break below the $10,300 level and 100 hourly simple moving average. A swing low was formed near $10,095 and the price is currently consolidating losses. An immediate resistance is near the $10,200 level and the 100 hourly simple moving average. Additionally, the 23.6% Fib retracement level of the recent decline from the $10,697 high to $10,095 low is also near $10,235. The next key resistance is near the $10,350 level and a connecting bearish trend line on the hourly chart.
Above the trend line, the next resistance is near $10,400. It coincides with the 50% Fib retracement level of the recent decline from the $10,697 high to $10,095 low. The main resistance for bitcoin is near the $10,500 level. A successful daily close above $10,500 is needed for a solid upward move. Besides, there is a rising channel or a bearish flag forming with support near $10,040 on the hourly chart of the BTC/USD pair.
If there is a downside break below the channel support, the price could even break the $10,000 support. The next key support is near the $9,800 area, below which there is a risk of a sharp decline towards $9,500 and $9,250.
Looking at the chart, bitcoin price is clearly trading in a bearish zone below the $10,400 and $10,500 levels. Overall, if the price continues to struggle, the bears are likely to aim a break below $9,800.
Technical indicators:
Hourly MACD – The MACD is currently gaining pace in the bearish zone.
Hourly RSI (Relative Strength Index) – The RSI for BTC/USD is now well below the 50 level.
Major Support Levels – $10,000 followed by $9,800.
Major Resistance Levels – $10,300, $10,400 and $10,500.
The post Bitcoin (BTC) Price Poised For Continued Weakness appeared first on NewsBTC.


No comments: