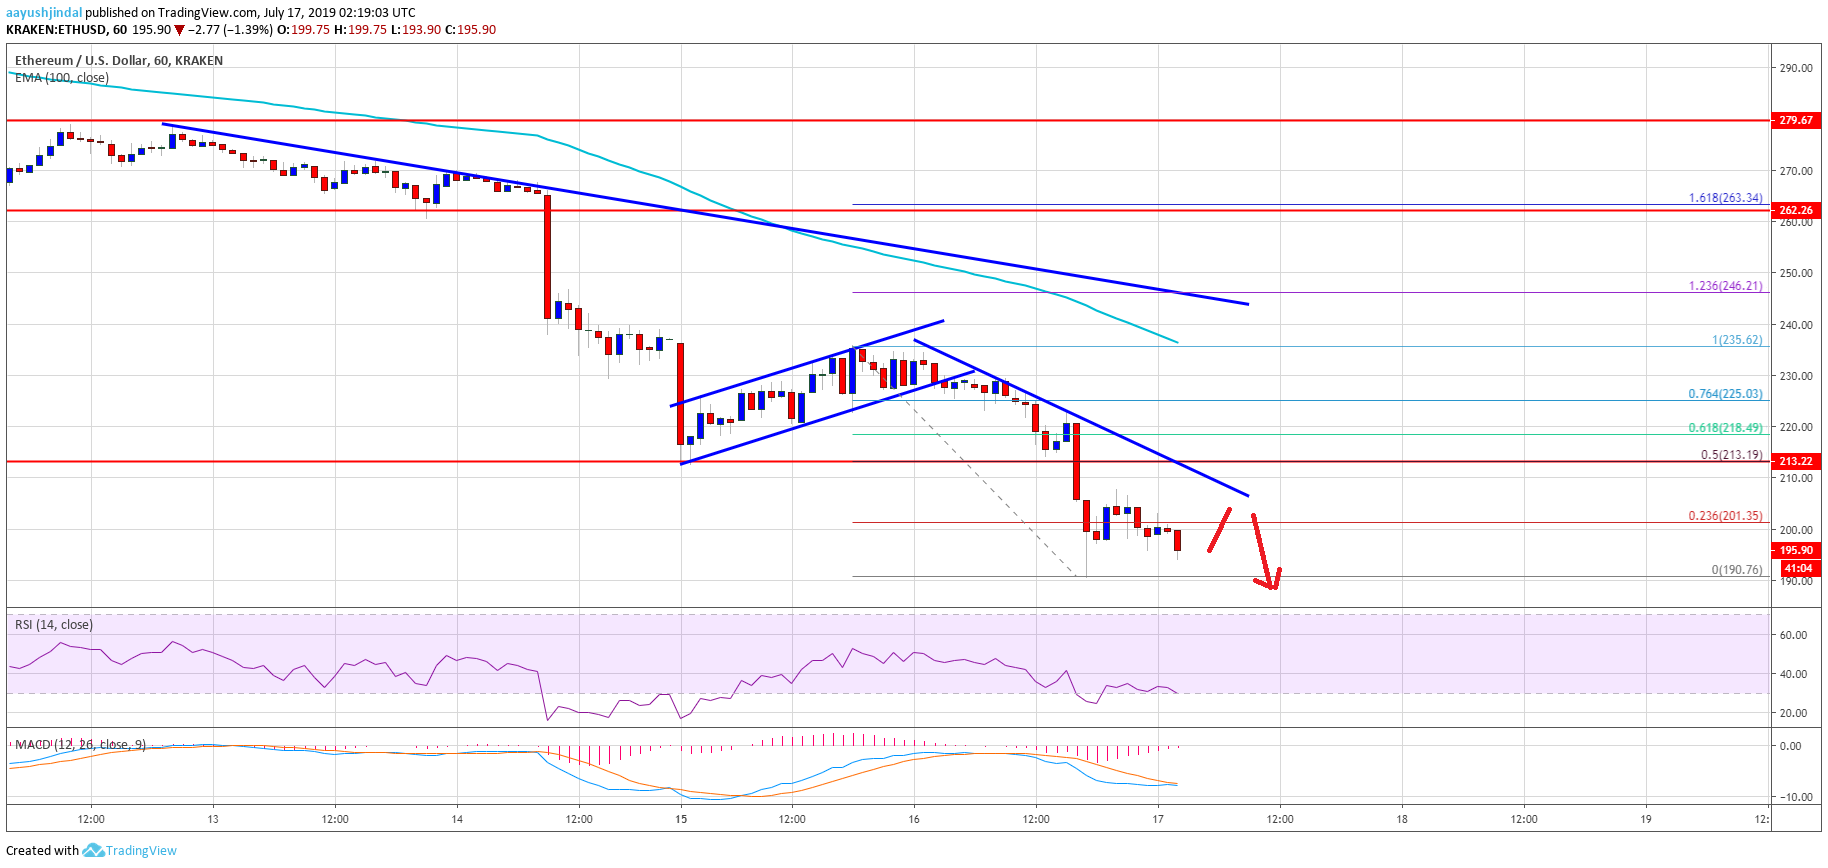
- ETH price declined heavily and broke the $220 and $210 support levels against the US Dollar.
- The price is down around 15% and it even broke the $200 support area to move into a bearish zone.
- There is a key bearish trend line forming with resistance near $210 on the hourly chart of ETH/USD (data feed via Kraken).
- The pair is likely to slide further below the $192 and $190 support levels in the near term.
Ethereum price is declining heavily and is already down more than 15% versus the US Dollar, similar to bitcoin. ETH price could continue to slide if it breaks the $190 support area.
Ethereum Price Analysis
After a short term upside correction, Ethereum price failed to gain traction above $235 against the US Dollar. ETH/USD started a fresh decline and broke a couple of important supports near the $225 and $220 levels. More importantly, bitcoin price failed near $11,000 and recently declined more than $1,000. The current price action is very bearish and it seems like ETH could continue to dive below the $200 support level.
During the recent slide, there was a break below a major ascending channel with support near $230 on the hourly chart of ETH/USD. It opened the doors for a fresh decline below the $220 and $210 levels. Moreover, there was a break below the $200 support and the price settled well below the 100 hourly simple moving average. A new monthly low was formed near the $190 level and the price is still trading with a bearish angle.
An immediate resistance is near the $200 level plus the 23.6% Fib retracement level of the recent drop from the $235 high to $190 low. Moreover, there is a key bearish trend line forming with resistance near $210 on the same chart. The 50% Fib retracement level of the recent drop from the $235 high to $190 low is also near the $213 level to act as a strong resistance in the near term.
On the downside, an immediate support is near the $192 and $190 levels. If there is a downside break below the $190 support, the price may test the $185 support. The main support for the bulls is near the $180 level.
Looking at the chart, Ethereum price is under a lot of pressure below $200, while bitcoin price dived below $9,500. Therefore, there could be more downsides below the $190 level in the near term.
ETH Technical Indicators
Hourly MACD – The MACD for ETH/USD is currently showing negative signs in the bearish zone.
Hourly RSI – The RSI for ETH/USD declined heavily and it is now well below the 40 level.
Major Support Level – $190
Major Resistance Level – $213
The post Ethereum Price (ETH) Dives Below $200 & BTC Down 15% appeared first on NewsBTC.


No comments: