- ETH price declined heavily below the key $300 support area against the US Dollar.
- The price traded close to the $260 support level and it is currently consolidating losses.
- There is a short term bearish trend line forming with resistance near $274 on the hourly chart of ETH/USD (data feed via Kraken).
- The pair could correct higher in the near term, but it is likely to struggle near the $282 and $285 resistances.
Ethereum price started consolidating losses after a sharp dip versus the US Dollar and bitcoin. ETH price might correct higher towards $285 in the coming sessions.
Ethereum Price Analysis
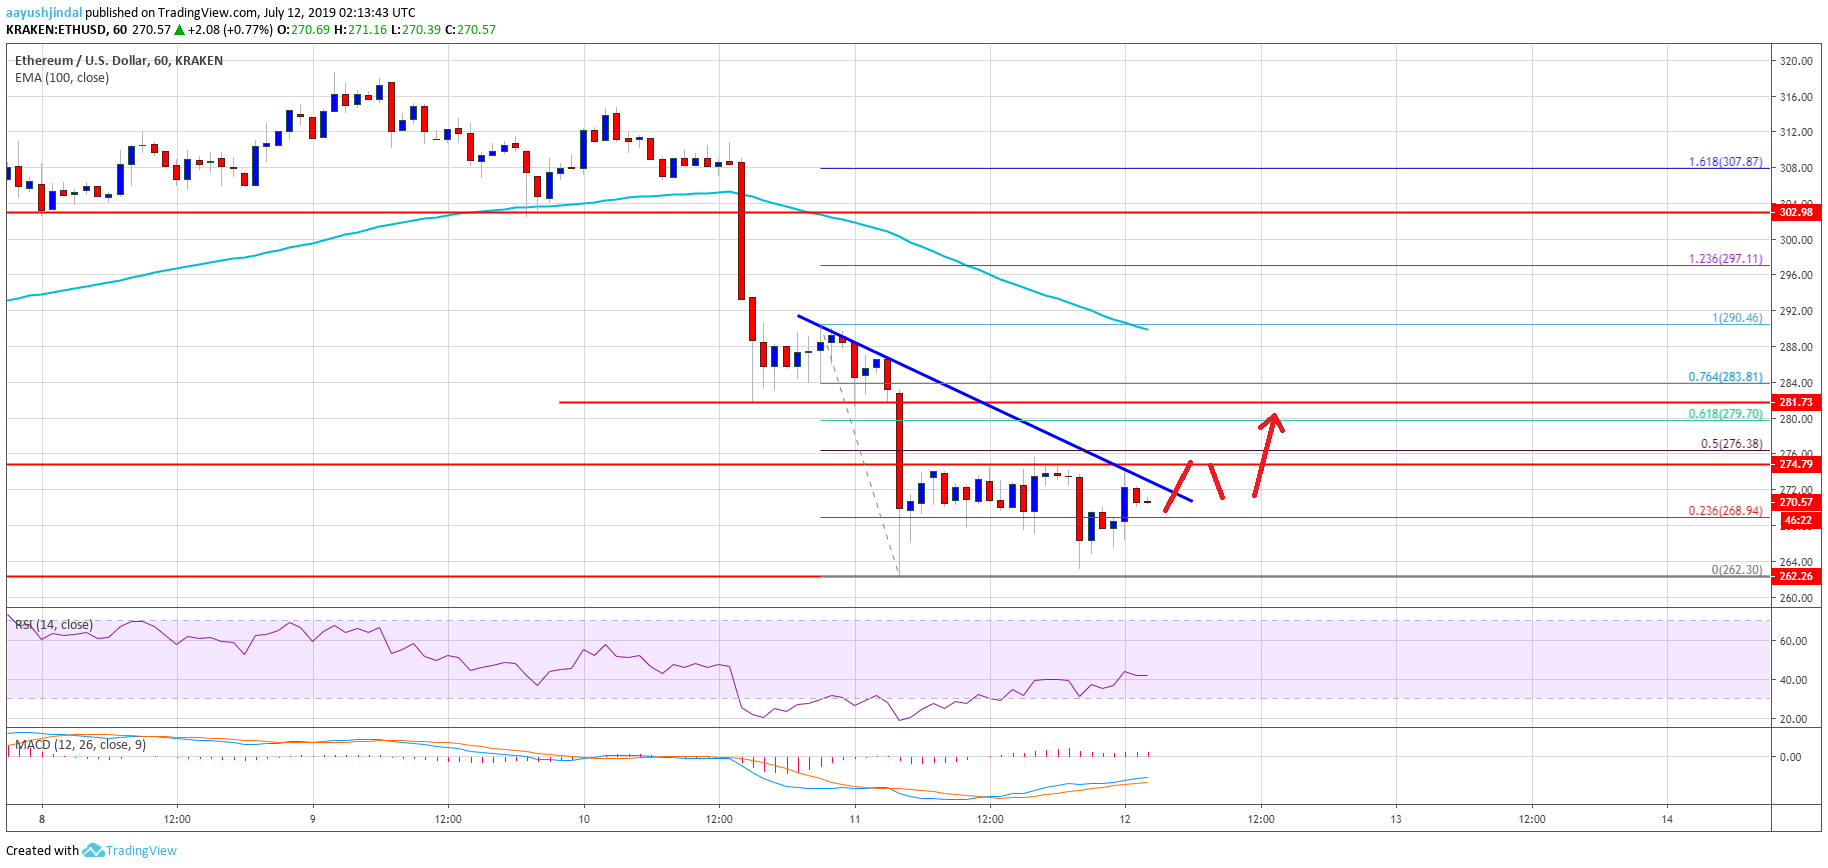
Yesterday, we saw a massive drop in bitcoin, Ethereum, ripple and other major altcoins against the US Dollar. ETH/USD declined heavily below the key $300 support area and it even broke the $285 support. Moreover, there was a close below the $285 level and the 100 hourly simple moving average. The price traded close to the $262 level and recently started consolidating losses.
It corrected above the $270 level plus the 23.6% Fib retracement level of the recent decline from the $290 high to $262 swing low. However, the upward move was capped by the $275-276 area. Moreover, there is a short term bearish trend line forming with resistance near $274 on the hourly chart of ETH/USD. The 50% Fib retracement level of the recent decline from the $290 high to $262 swing low is also acting as a resistance.
The current price action suggests that the price is forming a support base for a short term correction above $275. If it clears the trend line, the next stop for the bulls could be near the $280-282 zone. The 61.8% Fib retracement level of the recent decline from the $290 high to $262 swing low is also likely to act as a resistance. To start a fresh increase, the price must settle above the $285 resistance.
Conversely, if there is no upside break above $275 or $280, the price could extend losses. An initial support is near the $262 level, below which the price is likely to break the $260 support level. The next major support is near the $250 level.
Looking at the chart, Ethereum price seems to be consolidating losses above $262 and it might correct higher. Having said that, the price is likely to face a strong resistance near the $280 or $285 level in the near term.
ETH Technical Indicators
Hourly MACD – The MACD for ETH/USD is currently placed in the bullish zone.
Hourly RSI – The RSI for ETH/USD is slowly moving higher, but it is still well below the 50 level.
Major Support Level – $262
Major Resistance Level – $280
The post Ethereum Price Consolidating Losses: ETH & BTC Could Correct Higher appeared first on NewsBTC.


No comments: