
- Bitcoin price declined heavily below the $9,800 and $9,500 support levels against the US Dollar.
- The price traded to a new weekly low at $9,118 and it is currently correcting higher.
- There is a crucial contracting triangle forming with resistance near $9,700 on the hourly chart of the BTC/USD pair (data feed from Kraken).
- The price could either climb above $9,700 and $9,800 or decline sharply towards $9,000.
Bitcoin price is holding the $9,300 support level against the US Dollar. However, BTC price remains at a risk of a fresh drop if it fails to break the $9,700 and $9,800 resistances.
Bitcoin Price Analysis
In the past two days, there bearish sharp bearish moves in bitcoin price below $10,000 against the US Dollar. The BTC/USD pair broke the $9,800 and $9,500 support levels to enter a bearish zone. Moreover, the pair spiked below the $9,300 support and settled below the 100 hourly simple moving average. Finally, the price traded close to the $9,100 level and formed a new weekly low at $9,118 before correcting higher.
It recovered above the $9,300 level plus the 23.6% Fib retracement level of the downward move from the $10,209 high to $9,118 low. The upward move was positive as the price climbed above the $9,500 level. However, the price is now facing a strong resistance near the $9,700 level. More importantly, there is a crucial contracting triangle forming with resistance near $9,700 on the hourly chart of the BTC/USD pair.
Additionally, the 50% Fib retracement level of the downward move from the $10,209 high to $9,118 low is also acting as a strong resistance. Above the $9,700 level, the 100 hourly simple moving average is near the $9,750 level to act as a resistance. The next key resistance is near the $9,800 level, above which the price could stage a decent recovery towards the $10,200 resistance or $10,400.
Conversely, if there is no upside break above $9,700 or $9,800, the price could start a fresh decrease. An immediate support is near the $9,500 level and the triangle support. A clear break below $9,500 might call for a solid drop towards the $9,000 handle in the near term.
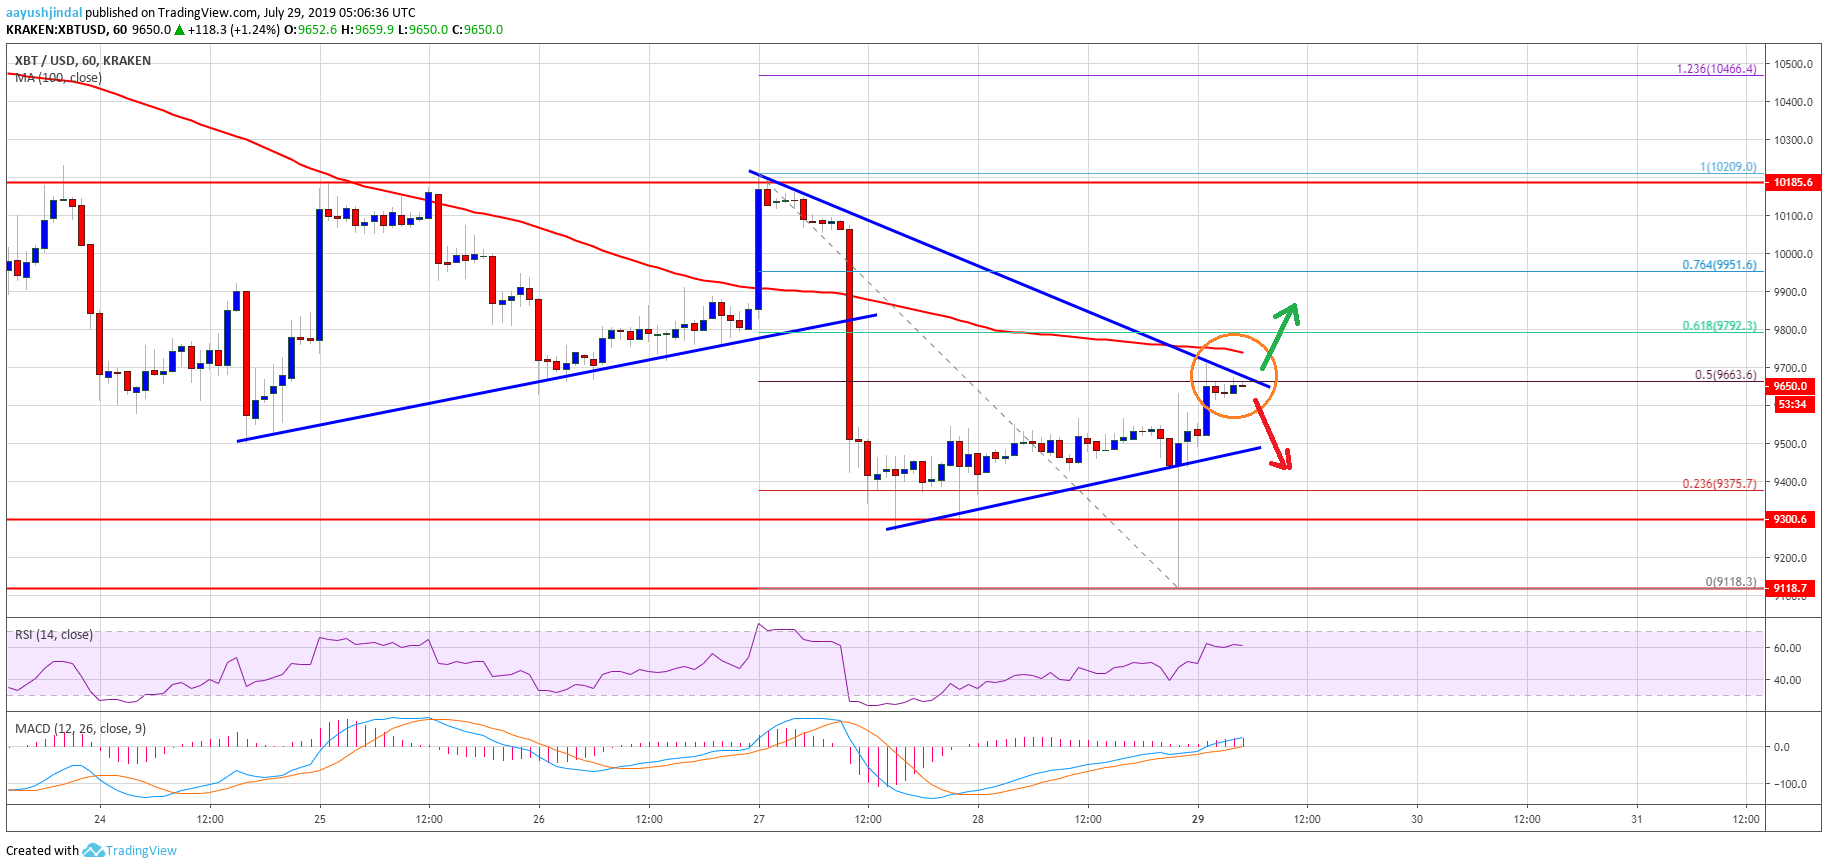
Looking at the chart, bitcoin price is facing a strong resistance near $9,700. Therefore, if there is a clear break above $9,700 and a follow through above the 100 hourly SMA, the price could continue to rise positively. If not, there is a risk of another strong decline towards the $9,000 level.
Technical indicators:
Hourly MACD – The MACD is placed nicely in the bullish zone.
Hourly RSI (Relative Strength Index) – The RSI for BTC/USD is currently above the 60 level, with positive signs.
Major Support Levels – $9,500 followed by $9,300.
Major Resistance Levels – $9,700, $9,800 and $10,200.
The post Bitcoin Price (BTC) Trading Near Inflection Point, Can Bulls Make It? appeared first on NewsBTC.
No comments: