- Bitcoin price started a decent upside correction after trading as low as $9,784 against the US Dollar.
- The price traded above the $10,500 and $10,800 resistance levels to start the recent recovery.
- Yesterday’s highlighted major bearish trend line was breached with resistance near $10,680 on the hourly chart of the BTC/USD pair (data feed from Kraken).
- The price is now facing a strong resistance near the $11,000 and $11,100 resistance levels.
Bitcoin price started a strong recovery above $10,500 against the US Dollar. However, BTC is still struggling to settle above $11,000 and it could resume its decline in the near term.
Bitcoin Price Analysis
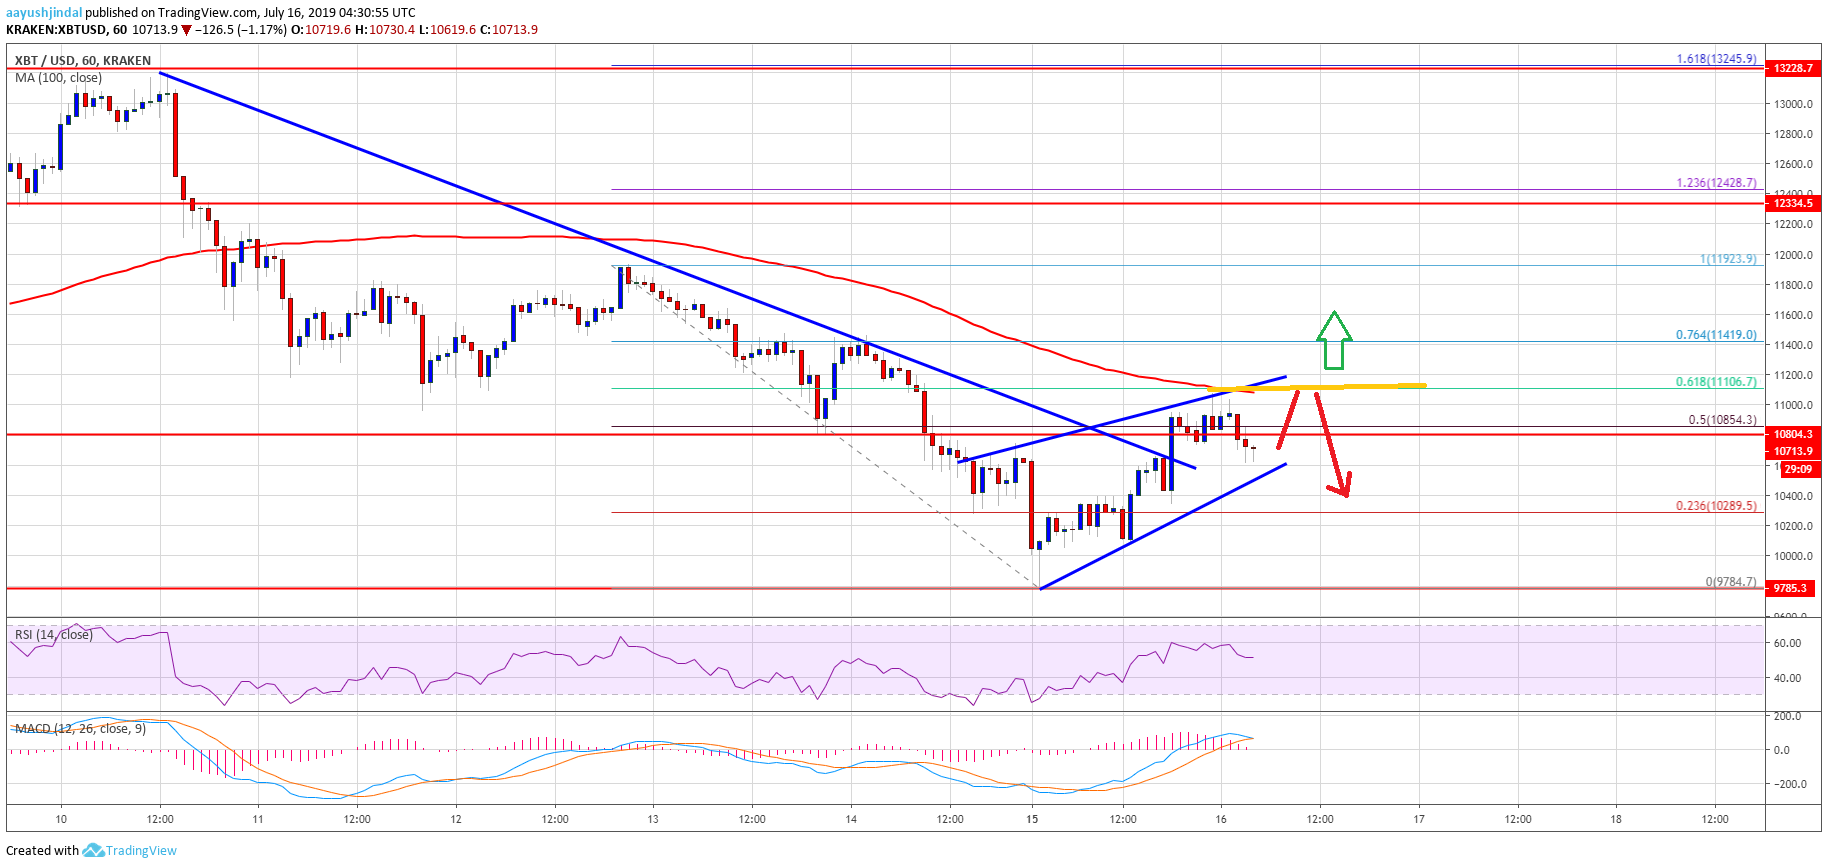
Recently, we saw a significant decline in bitcoin price below the $11,000 support against the US Dollar. The BTC/USD pair also spiked below the $10,000 support and settled below the 100 hourly simple moving average. A new monthly low was formed near $9,784 and the price recently started an upside correction. There was a strong upward move above the $10,300 and $10,500 resistance levels.
Moreover, the price traded above the 23.6% Fib retracement level of the last key drop from the $11,923 high to $9,784 low. Additionally, yesterday’s highlighted major bearish trend line was breached with resistance near $10,680 on the hourly chart of the BTC/USD pair. The pair even spiked above the 50% Fib retracement level of the last key drop from the $11,923 high to $9,784 low.
However, the price struggled to hold gains above the $11,000 resistance level. It seems like the $11,100 level and the 100 hourly SMA acted as a hurdle. Besides, the 61.8% Fib retracement level of the last key drop from the $11,923 high to $9,784 low also prevented gains. At the moment, the price is correcting gains below the $10,900 level. It seems like there is a breakout pattern forming with resistance near $11,100 on the same chart.
If there is a successful close above the $11,100 resistance and the 100 hourly SMA, there could be a convincing upward move towards the $11,500 resistance. Conversely, if there is no close above $11,000 and $11,100, the price is likely to resume its slide in the near term.
Looking at the chart, bitcoin price is clearly facing a strong resistance near the $11,000 and $11,100 levels. As long as the price is below $11,100 and the 100 hourly SMA, the bears remain in control. Therefore, BTC is likely to resume its downward move.
Technical indicators:
Hourly MACD – The MACD is about to move back in the bearish zone.
Hourly RSI (Relative Strength Index) – The RSI for BTC/USD settled above the 50 level, but it lacking momentum.
Major Support Levels – $10,500 followed by $10,000.
Major Resistance Levels – $11,000, $11,100 and $11,500.
The post Bitcoin Price (BTC) Trading Near Inflection Point After Recent Recovery appeared first on NewsBTC.


No comments: