- There was a strong buying interest for bitcoin near the $6,800 support area against the US Dollar.
- The price started a fresh increase and broke the $7,000 and $7,500 resistance levels.
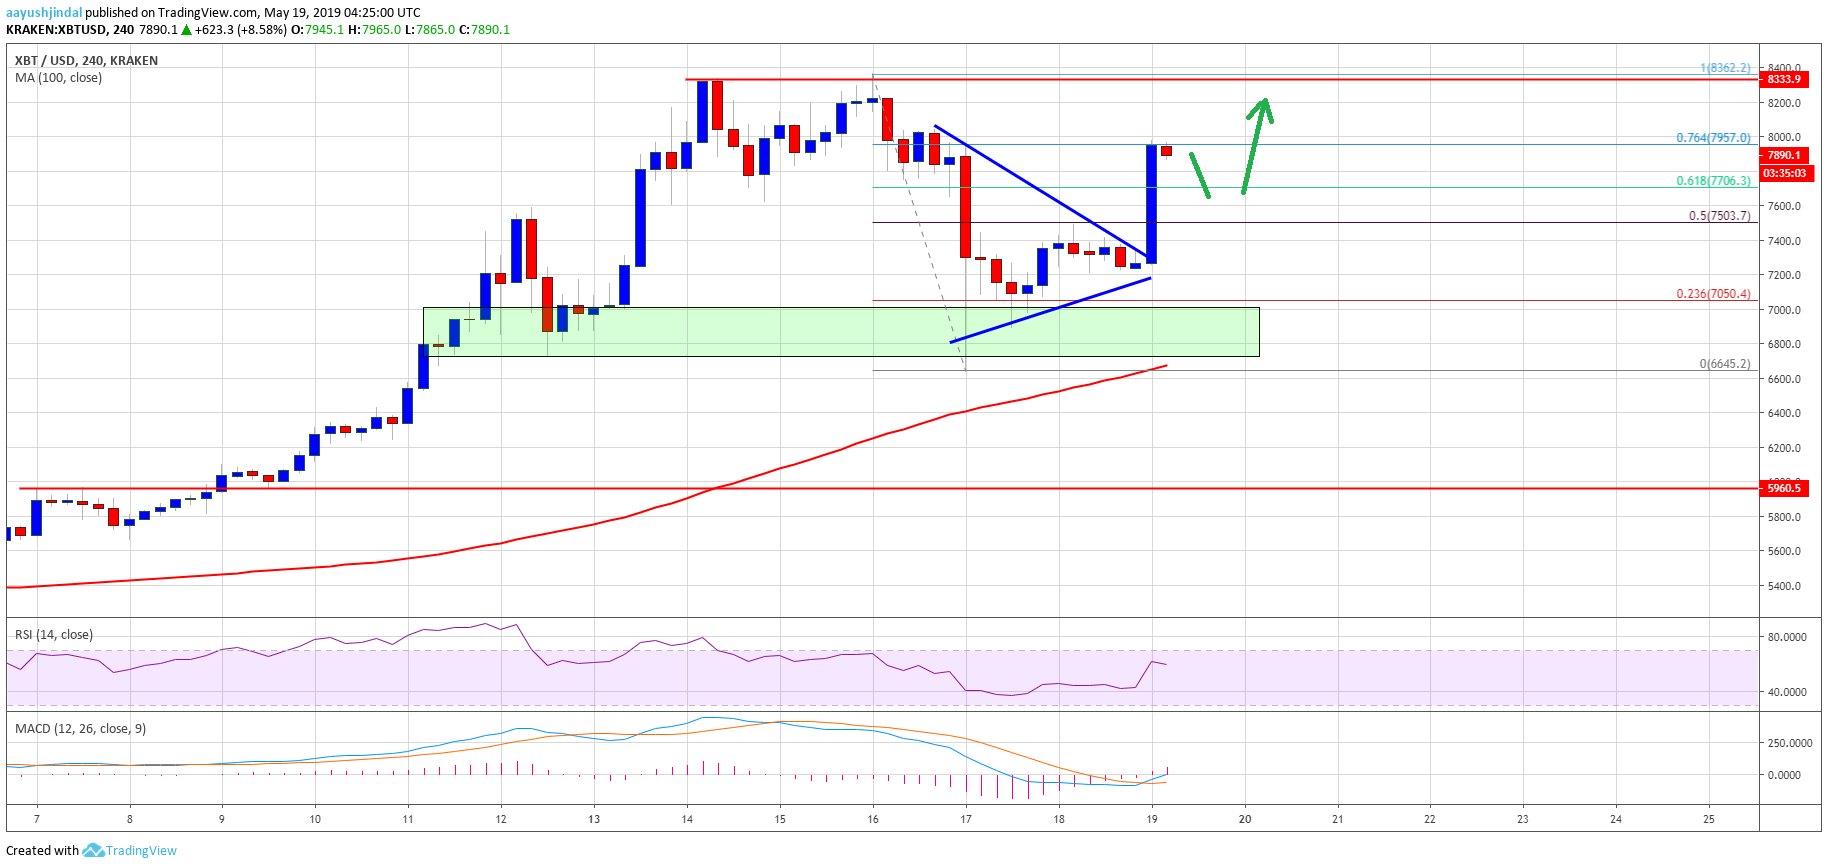
- There was a break above a major contracting triangle with resistance near $7,300 on the 4-hours chart of the BTC/USD pair (data feed from Kraken).
- The pair is eyeing a strong rise and it could trade above $8,500 and $8,800 in the near term.
Bitcoin price is up more than 10% after a strong downside correction against the US Dollar. BTC is now eying further upsides and it could even test the $9,000 resistance area.
Bitcoin Price Weekly Analysis (BTC)
This past week, bitcoin price rallied significantly above the $7,000 resistance against the US Dollar. The BTC/USD pair broke many barriers near $7,000, $7,200 and $7,800. The pair even surged above the $8,000 level and traded to a new 219 high near the $8,360 level. Later, there was a sharp downside correction below the $8,000 support, but the price stayed well above the 100 simple moving average (4-hours). It broke the $7,200 support area, but found a strong buying interest near the $6,650 and $6,800 levels.
A swing low was formed at $6,645 and the price recently recovered nicely. It climbed sharply above the $7,000 and $7,200 resistance levels. Moreover, there was a break above the 50% Fib retracement level of the downside correction from the $8,362 high to $6,645 low. More importantly, there was a break above a major contracting triangle with resistance near $7,300 on the 4-hours chart of the BTC/USD pair. The pair is now trading above the $7,700 resistance and the 61.8% Fib retracement level of the downside correction from the $8,362 high to $6,645 low.
These all are positive signs and it seems like the price may continue to surge above the $8,000 barrier. The next key resistance above $8,000 is near the $8,350 level. If the bulls gains pace above $8,362 swing high, it will most likely open the doors for a sharp rally towards the $8,600 and $8,800 resistance levels.
Looking at the chart, bitcoin price rebounded nicely after a strong decline towards $6,650. It is now up more than 10% and it seems like it could continue higher towards $8,200 and $8,500. The main target for the bulls in the coming sessions could be $8,800 or even $9,000. The key supports on the downside are near $7,500, $7,200 and $7,000.
Technical indicators
4 hours MACD – The MACD for BTC/USD is gaining pace in the bullish zone.
4 hours RSI (Relative Strength Index) – The RSI for BTC/USD is back above 50 and it could continue towards 70.
Major Support Level – $7,200
Major Resistance Level – $8,350
The post Bitcoin (BTC) Price Weekly Prediction: Indicators Suggest Rally To $9,000 appeared first on NewsBTC.


No comments: