- Ripple price traded as low as $0.3134 and recently corrected higher against the US dollar.
- The price broke the $0.3200 resistance area, but it is still below the key $0.3280 resistance.
- Yesterday’s highlighted key bearish trend line is intact with resistance near $0.3280 on the hourly chart of the XRP/USD pair (data source from Kraken).
- The pair must break the trend line and $0.3300 to move into a positive zone.
Ripple price managed to recover a few points against the US Dollar, similar to bitcoin. XRP is currently trading above the $0.3200 level and it could attempt to break the $0.3280 resistance area.
Ripple Price Analysis
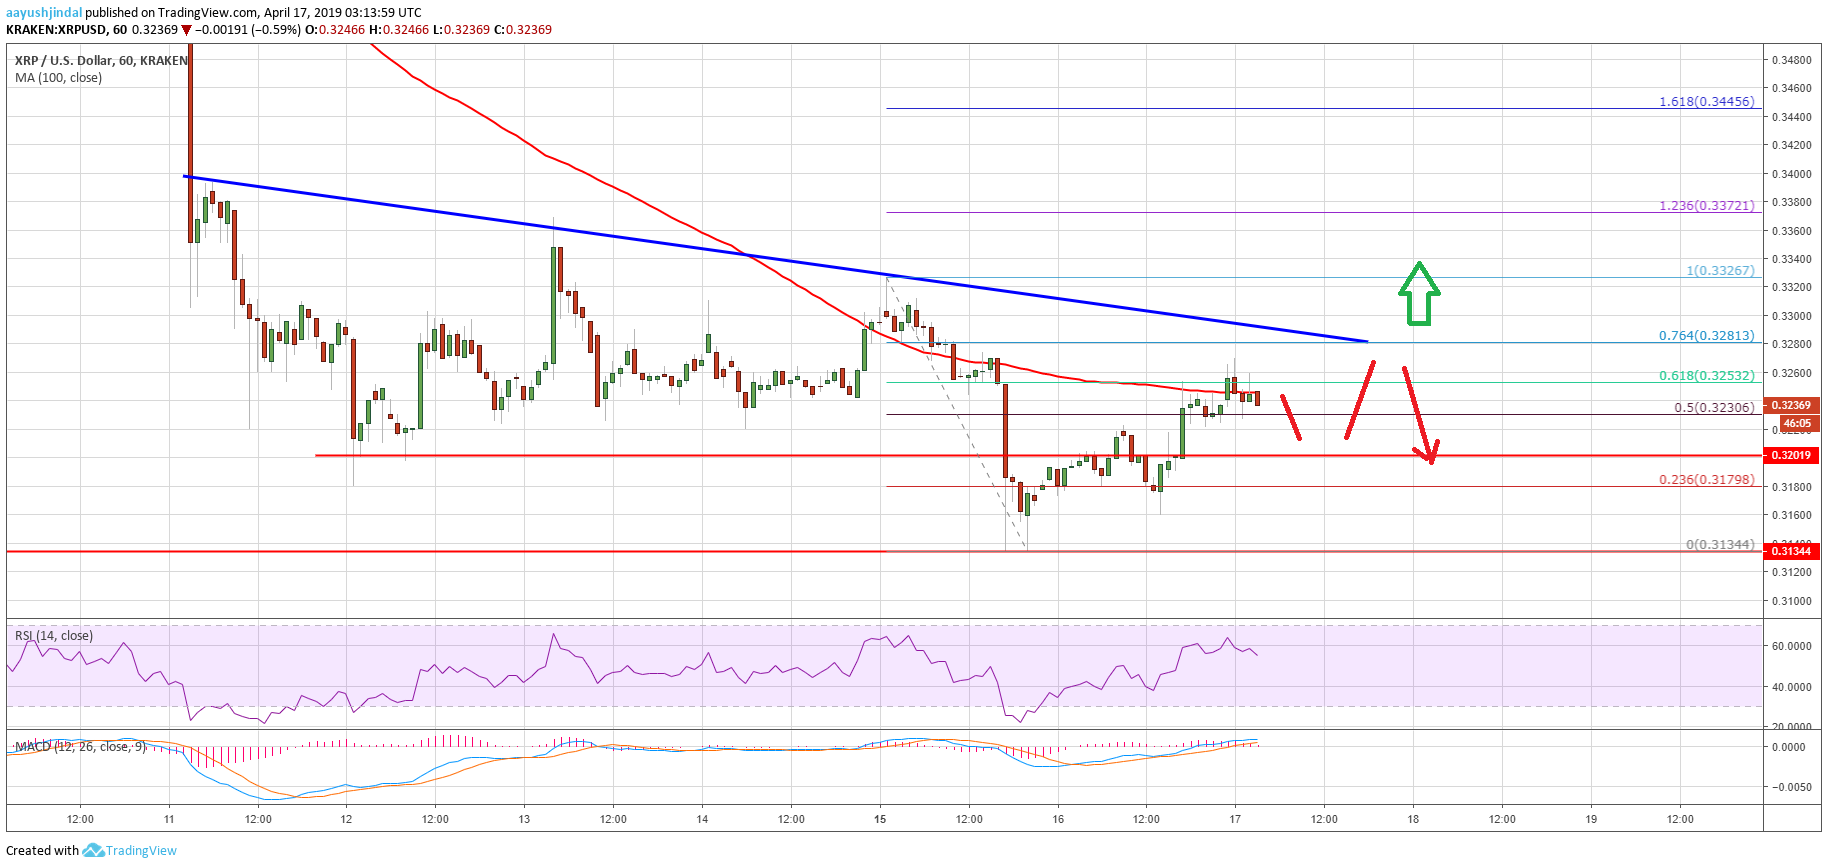
Recently, there was a downside extension below the $0.3200 support in ripple price against the US Dollar. The XRP/USD pair even traded below the $0.3150 level and formed a new weekly low at $0.3134. Later, the price started an upside correction above the $0.3140 and $0.3150 resistance levels. Buyers gained traction above the $0.3200 resistance and the 50% Fib retracement level of the last drop from the $0.3325 high to $0.3134 low.
It opened the doors for more gains and the price traded towards the $0.3260 level and 100 hourly simple moving average. However, the price struggled to stay above the 61.8% Fib retracement level of the last drop from the $0.3325 high to $0.3134 low. Moreover, yesterday’s highlighted key bearish trend line is intact with resistance near $0.3280 on the hourly chart of the XRP/USD pair. Sooner or later, the pair could make an attempt to surpass the trend line and $0.3285.
If buyers succeed in clearing the $0.3280 resistance area, there are chances of a solid upward move above the $0.3300 level. The next key resistance is at 1.236 Fib extension level of the last drop from the $0.3325 high to $0.3134 low at $0.3372. On the other hand, if the price fails to move above the $0.3280 resistance, there could be fresh decline. On the downside, an initial support is at $0.3200, below which the price could trade towards the $0.3160 and $0.3150 levels.

Looking at the chart, ripple price is currently showing positive signs above $0.3200. Having said that, a proper close above $0.3280 and $0.3300 is must for more gains in the near term. If bulls continue to struggle near $0.3280, there could be another bearish reaction below $0.3200 in the coming sessions.
Technical Indicators
Hourly MACD – The MACD for XRP/USD seems to be struggling to stay in the bullish zone.
Hourly RSI (Relative Strength Index) – The RSI for XRP/USD is currently moving lower towards the 50 level.
Major Support Levels – $0.3200, $0.3150 and $0.3130.
Major Resistance Levels – $0.3280, $0.3300 and $0.3370.
The post Ripple (XRP) Price Approaching Key Resistance, Can Buyers Make It? appeared first on NewsBTC.

No comments: