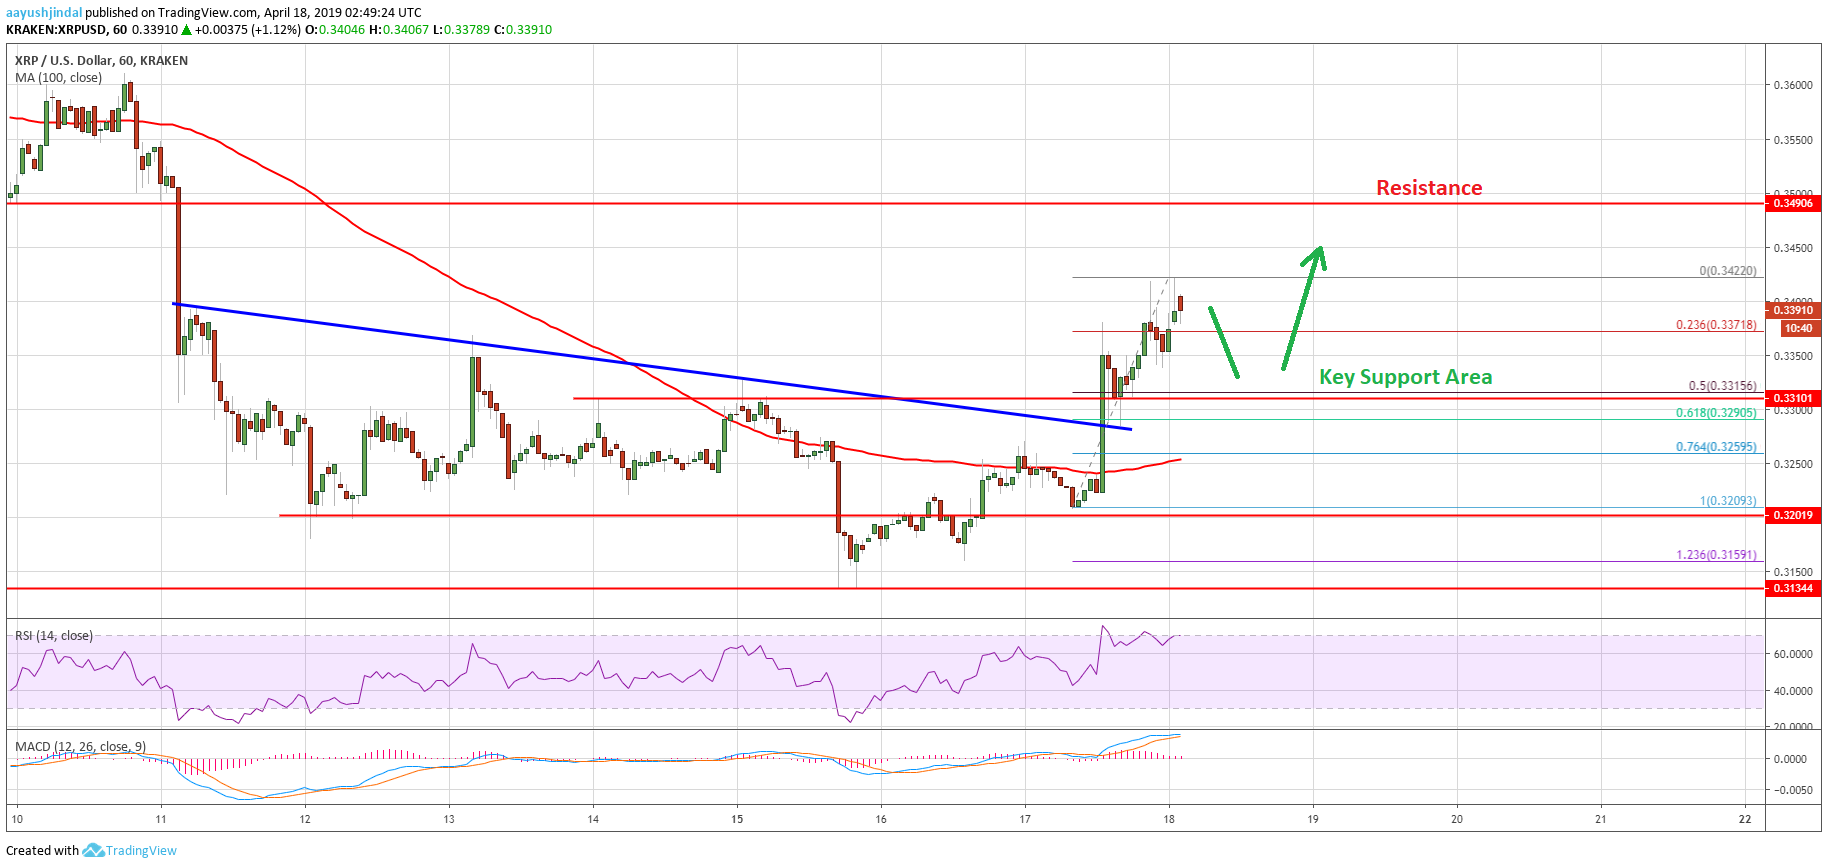
- Ripple price gained bullish momentum and broke the $0.3265 and $0.3300 resistances against the US dollar.
- The price even climbed above the $0.3350 resistance level to move into a positive zone.
- This week’s highlighted key bearish trend line was breached with resistance near $0.3288 on the hourly chart of the XRP/USD pair (data source from Kraken).
- The pair traded close to $0.3420 and now it remains well supported above the $0.3290 level.
Ripple price recovered nicely and gained bullish momentum against the US Dollar, along with bitcoin. XRP is likely to extend gains towards the $0.3500 or $0.3520 level in the near term.
Ripple Price Analysis
Yesterday, we saw a decent recovery above the $0.3200 resistance area in ripple price against the US Dollar. The XRP/USD pair settled above the $0.3210 level and later started trading in a range. Finally, buyers had the upper hand and pushed the price above the $0.3250 resistance and the 100 hourly simple moving average. It opened the doors for more gains and the price broke the 61.8% Fib retracement level of the decline from the $0.3330 swing high to $0.3135 low.
More importantly, this week’s highlighted key bearish trend line was breached with resistance near $0.3288 on the hourly chart of the XRP/USD pair. The pair climbed sharply above the $0.3350 resistance level to move into a positive zone. Finally, there was a break above the $0.3400 level and the price traded as high as $0.3422. Recently, there was a minor downside correction below $0.3380 and the 23.6% Fib retracement level of the last wave from the $0.3209 low to $0.3422 high. However, dips remain supported above the $0.3300 level. An initial support is at $0.3320.
The 50% Fib retracement level of the last wave from the $0.3209 low to $0.3422 high is also near $0.3315 to act as a support. The next main support is near $0.3260 and the 100 hourly simple moving average. Therefore, if the price corrects lower further, it could find a strong support near the $0.3320 and $0.3300 levels. On the upside, a break above the $0.3422 high is likely to push the price towards the $0.3500 level.

Looking at the chart, ripple price clearly moved into a positive zone above the $0.3300 and $0.3320 levels. It may continue to rise if buyers clear the $0.3420 and $0.3450 resistance levels in the near term.
Technical Indicators
Hourly MACD – The MACD for XRP/USD is currently placed nicely in the bullish zone, with positive signs.
Hourly RSI (Relative Strength Index) – The RSI for XRP/USD is currently well above the 60 level, with a bullish bias.
Major Support Levels – $0.3320, $0.3300 and $0.3265.
Major Resistance Levels – $0.3420, $0.3450 and $0.3500.
The post Ripple (XRP) Price Analysis: Bulls Aiming $0.3500 or Higher appeared first on NewsBTC.

No comments: